
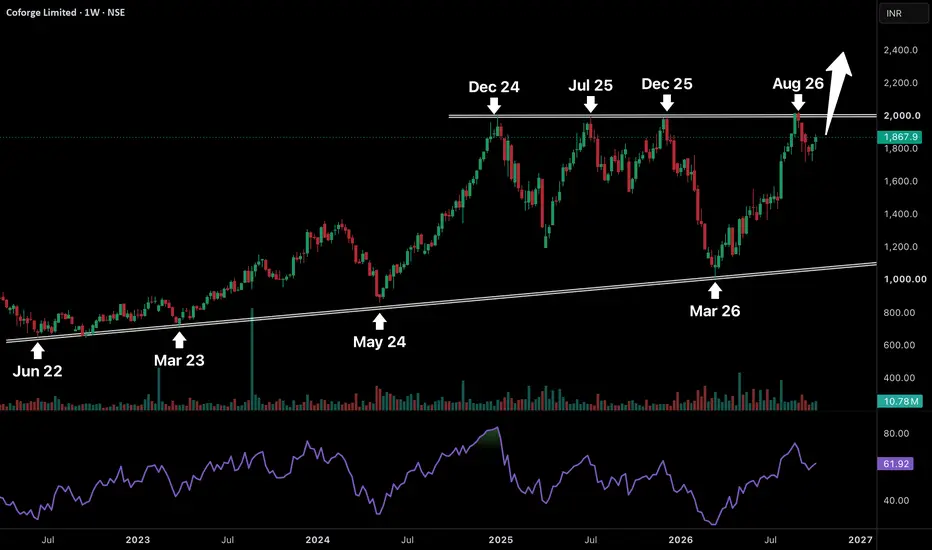
Coforge is once again approaching one of the most important resistance zones in its entire price structure. If we observe the weekly chart the stock has attempted to break above the 1,950–2,000 zone four different times since December 2024. Every attempt attracted selling pressure and resulted in a correction. But the interesting part is that despite these repeated rejections the stock has continued respecting its long-term rising support trendline since June 2022. Even during the sharp correction in March 2026 buyers defended this trendline near 1,000 and the stock recovered almost 100% towards its previous highs. This tells us that the broader bullish structure is still intact and buyers have been consistently accumulating during major corrections. Now price is consolidating around 1,850–1,900 after another rejection from 2,000. The weekly RSI is holding above 60 which suggests momentum remains relatively strong despite the recent pullback.
What makes this setup powerful is the amount of liquidity sitting above the 2,000 resistance zone. Four major rejections have made this level extremely visible to traders. Many buyers are waiting for confirmation while short sellers may have placed their stop losses above these repeated highs. If Coforge manages to break and sustain above 2,000 on the weekly chart it could trigger fresh buying along with short covering. This combination can create strong momentum because price would be moving beyond a resistance that has controlled the stock for almost two years. The next potential expansion zone could be around 2,200–2,400 as marked by the bullish arrow. For now the 1,800–1,850 region remains important for maintaining near-term strength. The stock has already tested this resistance four times. One convincing breakout above 2,000 could completely change the momentum and open the door for a fresh price discovery phase.
What makes this setup powerful is the amount of liquidity sitting above the 2,000 resistance zone. Four major rejections have made this level extremely visible to traders. Many buyers are waiting for confirmation while short sellers may have placed their stop losses above these repeated highs. If Coforge manages to break and sustain above 2,000 on the weekly chart it could trigger fresh buying along with short covering. This combination can create strong momentum because price would be moving beyond a resistance that has controlled the stock for almost two years. The next potential expansion zone could be around 2,200–2,400 as marked by the bullish arrow. For now the 1,800–1,850 region remains important for maintaining near-term strength. The stock has already tested this resistance four times. One convincing breakout above 2,000 could completely change the momentum and open the door for a fresh price discovery phase.

📌 Join Trading Community 👇
Telegram : 👉telegram.me/chartifyy
Instagram: 👉 instagram.com/chartifyig?igsi=Y2ZiODZtczZ2aDA=&utm_source=qr
Telegram : 👉telegram.me/chartifyy
Instagram: 👉 instagram.com/chartifyig?igsi=Y2ZiODZtczZ2aDA=&utm_source=qr
Penafian
Maklumat dan penerbitan adalah tidak bertujuan, dan tidak membentuk, nasihat atau cadangan kewangan, pelaburan, dagangan atau jenis lain yang diberikan atau disahkan oleh TradingView. Baca lebih dalam Terma Penggunaan.
📌 Join Trading Community 👇
Telegram : 👉telegram.me/chartifyy
Instagram: 👉 instagram.com/chartifyig?igsi=Y2ZiODZtczZ2aDA=&utm_source=qr
Telegram : 👉telegram.me/chartifyy
Instagram: 👉 instagram.com/chartifyig?igsi=Y2ZiODZtczZ2aDA=&utm_source=qr
Penafian
Maklumat dan penerbitan adalah tidak bertujuan, dan tidak membentuk, nasihat atau cadangan kewangan, pelaburan, dagangan atau jenis lain yang diberikan atau disahkan oleh TradingView. Baca lebih dalam Terma Penggunaan.