Panjang
COMBOUSDT ANALYSIS
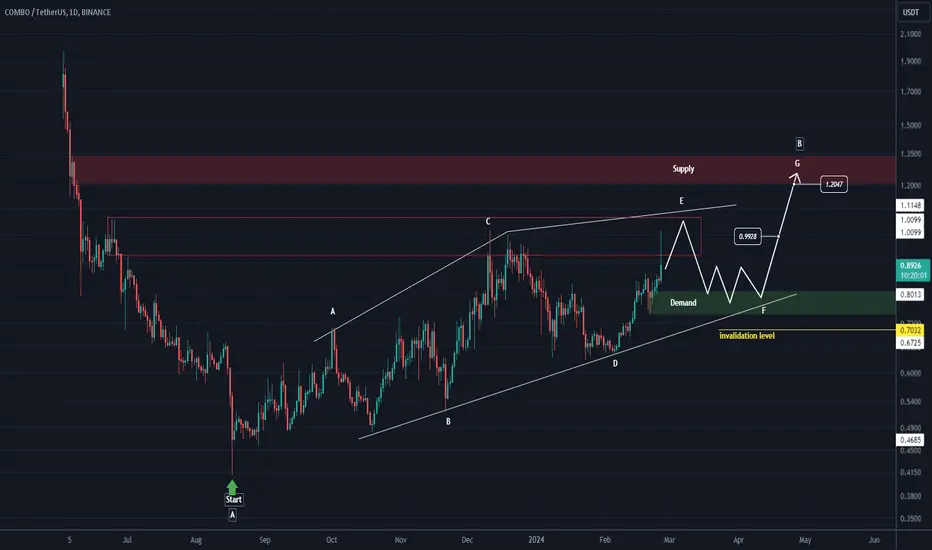
We don't have any data on the chart, but it seems that we have two big waves A and B on the chart.
Wave A has ended and wave B has started at the place where we inserted start on the chart.
Wave B looks like a diametric we are now in wave E of.
If pullback hits the green range, we will look for buy/long positions
Closing a daily candle below the invalidation level will violate the analysis
For risk management, please don't forget stop loss and capital management
When we reach the first target, save some profit and then change the stop to entry
Comment if you have any questions
Thank You
Wave A has ended and wave B has started at the place where we inserted start on the chart.
Wave B looks like a diametric we are now in wave E of.
If pullback hits the green range, we will look for buy/long positions
Closing a daily candle below the invalidation level will violate the analysis
For risk management, please don't forget stop loss and capital management
When we reach the first target, save some profit and then change the stop to entry
Comment if you have any questions
Thank You
Dagangan ditutup: sasaran tercapai
The desired moves were made
🔥 Don't Just Watch the Market. Understand It!
📊 Crypto Analysis & Setups:
👉 t.me/Behdark_EN
💹 Forex Analysis & Setups:
👉 t.me/FX_Behdark
🚀 Join BehDark for Market Insights, Trading Setups & Key Levels. Choose Your Market & Join Us!
📊 Crypto Analysis & Setups:
👉 t.me/Behdark_EN
💹 Forex Analysis & Setups:
👉 t.me/FX_Behdark
🚀 Join BehDark for Market Insights, Trading Setups & Key Levels. Choose Your Market & Join Us!
Penafian
Maklumat dan penerbitan adalah tidak bertujuan, dan tidak membentuk, nasihat atau cadangan kewangan, pelaburan, dagangan atau jenis lain yang diberikan atau disahkan oleh TradingView. Baca lebih dalam Terma Penggunaan.
🔥 Don't Just Watch the Market. Understand It!
📊 Crypto Analysis & Setups:
👉 t.me/Behdark_EN
💹 Forex Analysis & Setups:
👉 t.me/FX_Behdark
🚀 Join BehDark for Market Insights, Trading Setups & Key Levels. Choose Your Market & Join Us!
📊 Crypto Analysis & Setups:
👉 t.me/Behdark_EN
💹 Forex Analysis & Setups:
👉 t.me/FX_Behdark
🚀 Join BehDark for Market Insights, Trading Setups & Key Levels. Choose Your Market & Join Us!
Penafian
Maklumat dan penerbitan adalah tidak bertujuan, dan tidak membentuk, nasihat atau cadangan kewangan, pelaburan, dagangan atau jenis lain yang diberikan atau disahkan oleh TradingView. Baca lebih dalam Terma Penggunaan.