
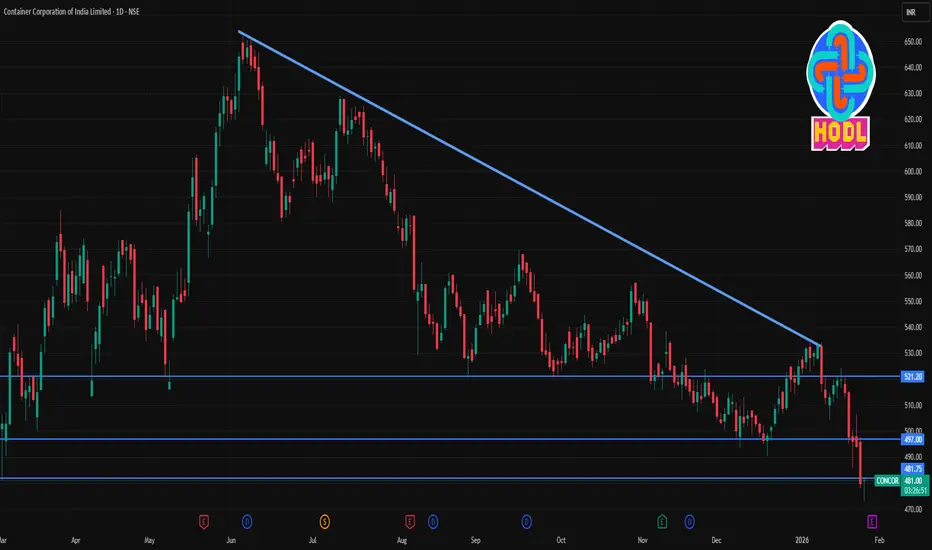
📊 CONCOR — 1‑Day Time Frame Key Levels (Indicative)
Current Price (recent session)
• ~₹478–₹480 (down intraday) — trading near session lows.
🔁 Pivot & Classic Levels (from standard technical calculation)
These are typical pivot/SR levels used by traders for one‑day setups:
Pivot Point: ~₹520
➡️ The central reference level where bias may shift.
If price trades above this level intraday → bullish bias; below → bearish bias.
Resistance Levels:
• R1: ~₹524
• R2: ~₹527
• R3: ~₹531
➡️ Levels where selling pressure may emerge if price rallies.
Support Levels:
• S1: ~₹516
• S2: ~₹513
• S3: ~₹509
➡️ Key intraday levels where buyers may step in on pullbacks.
📉 Today’s Range & Observations
Day’s High: ~₹497–₹498
Day’s Low: ~₹477–₹478
➡️ CONCOR is trading nearer its session low, showing short‑term selling pressure.
52‑Week Context:
• 52‑week low ~₹472–₹478
• 52‑week high ~₹652 (prior broader trend)
📌 How Traders Use These Levels (1 Day Time Frame)
Bullish Scenarios (intraday):
✔ If price breaks above Pivot (~₹520) with volume → potential move toward R1 ~₹524 and beyond.
✔ Strength above R1/R2 indicates buyers stepping in.
Bearish Scenarios (intraday):
✔ Price staying below pivot and failing at R1/R2 → continuation lower.
✔ Breakdown below S1 (~₹516) and S2/S3 amplifies downside pressure.

Contact Knowledgehub for a detailed consultation: Dm on WhatsApp: [wa.link/a2o0kz]-
Phone No: [+91 93102 26243]-
Email: [tradingviewknowledgehub@gmail.com]---
-- Let’s achieve success together!
Phone No: [+91 93102 26243]-
Email: [tradingviewknowledgehub@gmail.com]---
-- Let’s achieve success together!
Penerbitan berkaitan
Penafian
Maklumat dan penerbitan adalah tidak bertujuan, dan tidak membentuk, nasihat atau cadangan kewangan, pelaburan, dagangan atau jenis lain yang diberikan atau disahkan oleh TradingView. Baca lebih dalam Terma Penggunaan.