Cisco (CSCO) Stock Analysis
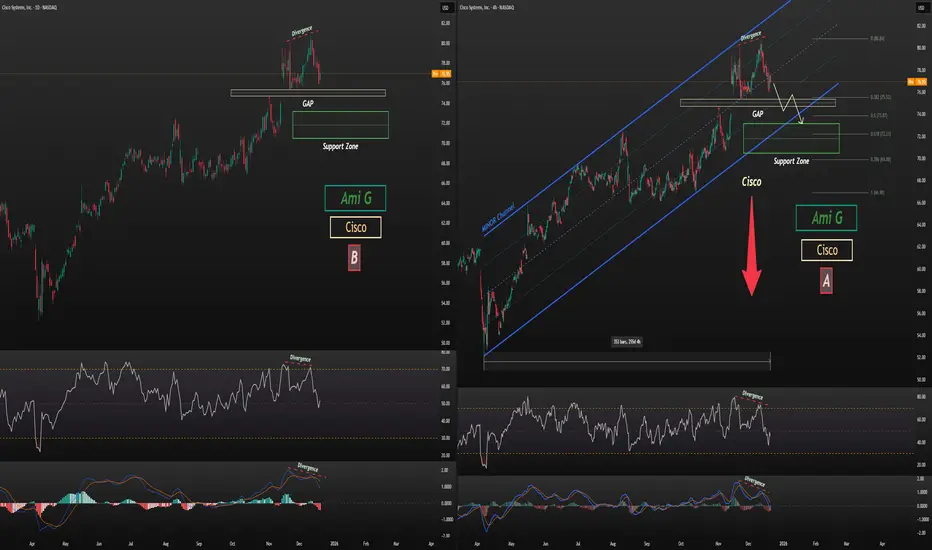
As shown on the chart, Cisco is trading near the upper boundary of its 9-month channel. After forming two strong divergences on the 4H chart (Chart A) and the daily chart (Chart B)—confirmed by both MACD and RSI—the stock has entered a corrective phase.
Given the presence of a very strong gap marked on the chart, price is likely to correct at least toward the gap zone, and potentially extend further to the support zone, which may also align with the lower boundary of the 9-month channel.
Analysis will be updated.
Follow me on TradingView for more analyses and live stock trades.
 CSCO
CSCO
As shown on the chart, Cisco is trading near the upper boundary of its 9-month channel. After forming two strong divergences on the 4H chart (Chart A) and the daily chart (Chart B)—confirmed by both MACD and RSI—the stock has entered a corrective phase.
Given the presence of a very strong gap marked on the chart, price is likely to correct at least toward the gap zone, and potentially extend further to the support zone, which may also align with the lower boundary of the 9-month channel.
Analysis will be updated.
Follow me on TradingView for more analyses and live stock trades.
CSCO Nota
As expected based on the analysis, price filled the first gap.Dagangan ditutup: sasaran tercapai
A very strong upward move originating from the marked support zone
AG-Precision-Trading
📈 Live Trading: Stocks & Crypto
🔍 Symbol Analysis & Insights
💎 Understanding Relative Asset Values
📈 Live Trading: Stocks & Crypto
🔍 Symbol Analysis & Insights
💎 Understanding Relative Asset Values
Penafian
Maklumat dan penerbitan adalah tidak bertujuan, dan tidak membentuk, nasihat atau cadangan kewangan, pelaburan, dagangan atau jenis lain yang diberikan atau disahkan oleh TradingView. Baca lebih dalam Terma Penggunaan.
AG-Precision-Trading
📈 Live Trading: Stocks & Crypto
🔍 Symbol Analysis & Insights
💎 Understanding Relative Asset Values
📈 Live Trading: Stocks & Crypto
🔍 Symbol Analysis & Insights
💎 Understanding Relative Asset Values
Penafian
Maklumat dan penerbitan adalah tidak bertujuan, dan tidak membentuk, nasihat atau cadangan kewangan, pelaburan, dagangan atau jenis lain yang diberikan atau disahkan oleh TradingView. Baca lebih dalam Terma Penggunaan.