
## **Dabur India Ltd – Daily Time Frame | Bullish Harmonic Reversal Setup**
📊 **Stock:** Dabur India Ltd (NSE)
💰 **CMP:** ₹375
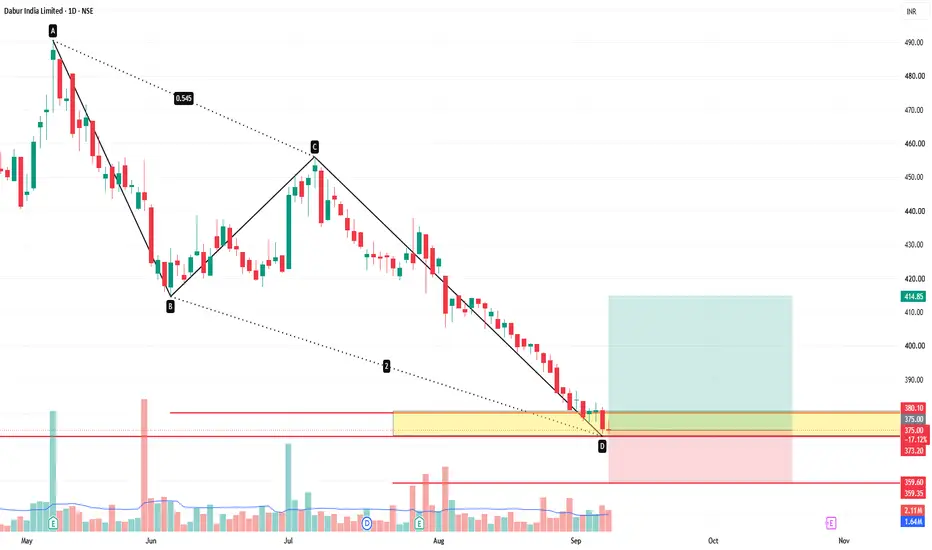
Dabur India is currently trading near a **Bullish Harmonic Reversal Zone around ₹373–₹380**. The XABCD structure has reached the **D point**, where price is interacting with a key support/PRZ area after a sustained decline from the ₹490 region.
### **Technical Outlook**
* 🟢 Bullish Harmonic pattern completed near **D**.
* 🟢 Strong PRZ/support zone around **₹373–₹380**.
* 🟢 Price is attempting to stabilize near the harmonic completion area.
* 📈 A sustained move above **₹380–₹385** could provide bullish confirmation.
* ⚠️ The broader structure remains under correction, so confirmation is important.
### **Potential Trading Plan**
* **Entry:** ₹375–₹385 after bullish confirmation
* **Stop Loss:** Below ₹359
* **Target 1:** ₹395
* **Target 2:** ₹405
* **Target 3:** ₹414–₹415
### **Key Levels**
**PRZ / Support:** ₹373–₹380
**Immediate Resistance:** ₹395
**Target Zone:** ₹405–₹415
**Major Invalidation:** Below ₹359
### **Risk Management**
A decisive daily close below **₹359** would weaken/invalidate the bullish harmonic setup and could lead to further downside. Traders should wait for a bullish reversal candle and follow-through before entering.
> **Conclusion:**
> Dabur India is positioned near an important **bullish harmonic reversal zone**. The **₹373–₹380** region is the key area to watch. If buyers defend this zone and the stock sustains above ₹385, the recovery could extend towards **₹395 → ₹405 → ₹414–₹415**. A breakdown below ₹359 would invalidate the setup.
**Disclaimer:** This analysis is for educational purposes only and should not be considered investment advice. Always use proper position sizing, confirmation, and strict risk management before taking a trade.
📊 **Stock:** Dabur India Ltd (NSE)
💰 **CMP:** ₹375
Dabur India is currently trading near a **Bullish Harmonic Reversal Zone around ₹373–₹380**. The XABCD structure has reached the **D point**, where price is interacting with a key support/PRZ area after a sustained decline from the ₹490 region.
### **Technical Outlook**
* 🟢 Bullish Harmonic pattern completed near **D**.
* 🟢 Strong PRZ/support zone around **₹373–₹380**.
* 🟢 Price is attempting to stabilize near the harmonic completion area.
* 📈 A sustained move above **₹380–₹385** could provide bullish confirmation.
* ⚠️ The broader structure remains under correction, so confirmation is important.
### **Potential Trading Plan**
* **Entry:** ₹375–₹385 after bullish confirmation
* **Stop Loss:** Below ₹359
* **Target 1:** ₹395
* **Target 2:** ₹405
* **Target 3:** ₹414–₹415
### **Key Levels**
**PRZ / Support:** ₹373–₹380
**Immediate Resistance:** ₹395
**Target Zone:** ₹405–₹415
**Major Invalidation:** Below ₹359
### **Risk Management**
A decisive daily close below **₹359** would weaken/invalidate the bullish harmonic setup and could lead to further downside. Traders should wait for a bullish reversal candle and follow-through before entering.
> **Conclusion:**
> Dabur India is positioned near an important **bullish harmonic reversal zone**. The **₹373–₹380** region is the key area to watch. If buyers defend this zone and the stock sustains above ₹385, the recovery could extend towards **₹395 → ₹405 → ₹414–₹415**. A breakdown below ₹359 would invalidate the setup.
**Disclaimer:** This analysis is for educational purposes only and should not be considered investment advice. Always use proper position sizing, confirmation, and strict risk management before taking a trade.

Penafian
Maklumat dan penerbitan adalah tidak bertujuan, dan tidak membentuk, nasihat atau cadangan kewangan, pelaburan, dagangan atau jenis lain yang diberikan atau disahkan oleh TradingView. Baca lebih dalam Terma Penggunaan.
Penafian
Maklumat dan penerbitan adalah tidak bertujuan, dan tidak membentuk, nasihat atau cadangan kewangan, pelaburan, dagangan atau jenis lain yang diberikan atau disahkan oleh TradingView. Baca lebih dalam Terma Penggunaan.