
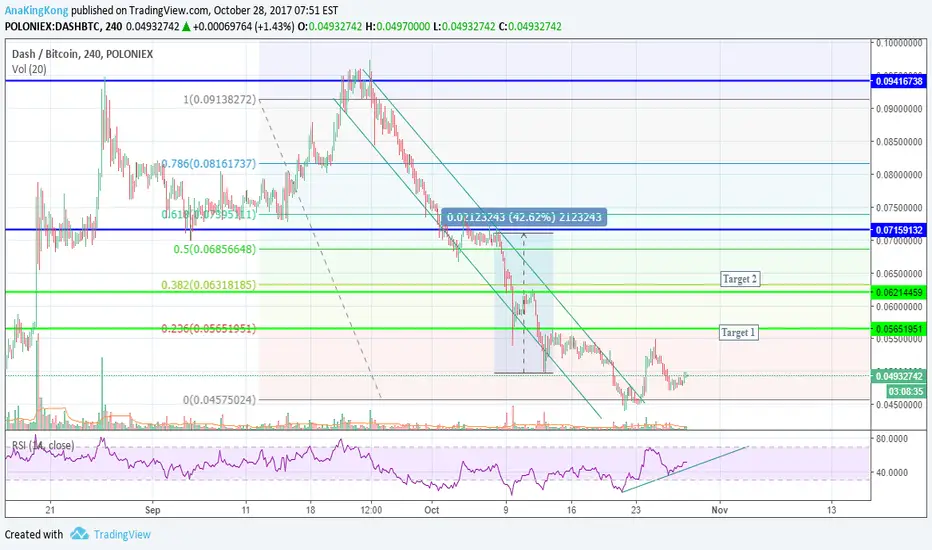
DASHBTC passed very hard time last month its dropped from its high @0.096 on 22 September to the bottom @ 0.044 21 October
(by 42 degrees) trendline, this decline came as a reaction of double top pattern which formed on 26 August
Now targets of the pattern is complete and the rising era finally came - we should watch carefully RSI indicator when reaching overbought zone -
Targets as always are marked by green lines
Thank you
------------------------------------------------------------
Don't read and leave .. Like, Comment and Follow ...... its so easy
(by 42 degrees) trendline, this decline came as a reaction of double top pattern which formed on 26 August
Now targets of the pattern is complete and the rising era finally came - we should watch carefully RSI indicator when reaching overbought zone -
Targets as always are marked by green lines
Thank you
------------------------------------------------------------
Don't read and leave .. Like, Comment and Follow ...... its so easy

Penafian
Maklumat dan penerbitan adalah tidak bertujuan, dan tidak membentuk, nasihat atau cadangan kewangan, pelaburan, dagangan atau jenis lain yang diberikan atau disahkan oleh TradingView. Baca lebih dalam Terma Penggunaan.
Penafian
Maklumat dan penerbitan adalah tidak bertujuan, dan tidak membentuk, nasihat atau cadangan kewangan, pelaburan, dagangan atau jenis lain yang diberikan atau disahkan oleh TradingView. Baca lebih dalam Terma Penggunaan.