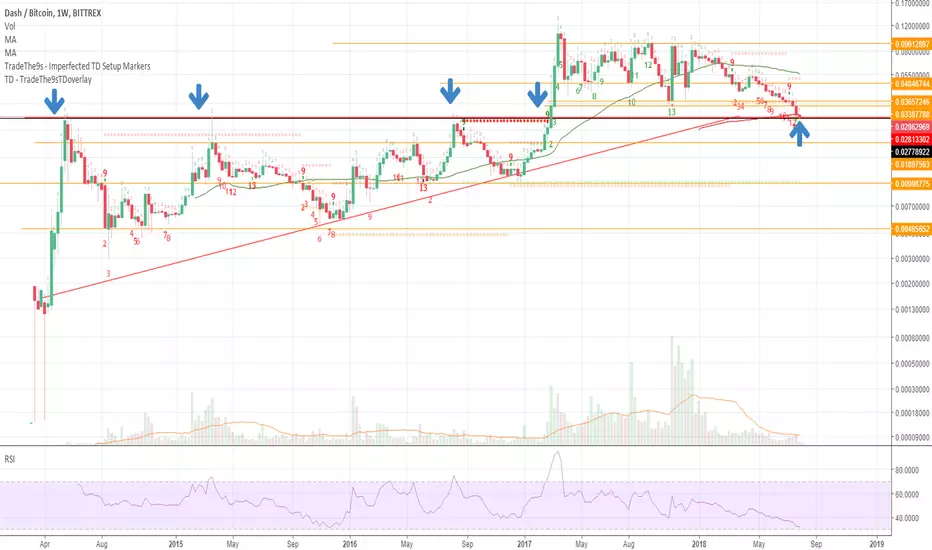
DDASHBTC testing a critical level on the weekly chart this week.
As you can see from the arrows, this level (black line) was tested multiple times before DASH had its massive breakout in 2017.
Zooming in on the 12H time frame below...you can see how the 12H came down to this line on a Perfected Buy Set Up and then flipped before completing the Set Up (Bullish).
Now trending back towards this level. Should it hold, will consider substantial long position.

Penafian
Maklumat dan penerbitan adalah tidak bertujuan, dan tidak membentuk, nasihat atau cadangan kewangan, pelaburan, dagangan atau jenis lain yang diberikan atau disahkan oleh TradingView. Baca lebih dalam Terma Penggunaan.
Penafian
Maklumat dan penerbitan adalah tidak bertujuan, dan tidak membentuk, nasihat atau cadangan kewangan, pelaburan, dagangan atau jenis lain yang diberikan atau disahkan oleh TradingView. Baca lebih dalam Terma Penggunaan.