Panjang
Long term health of DEFI in a critical moment - Triangle version
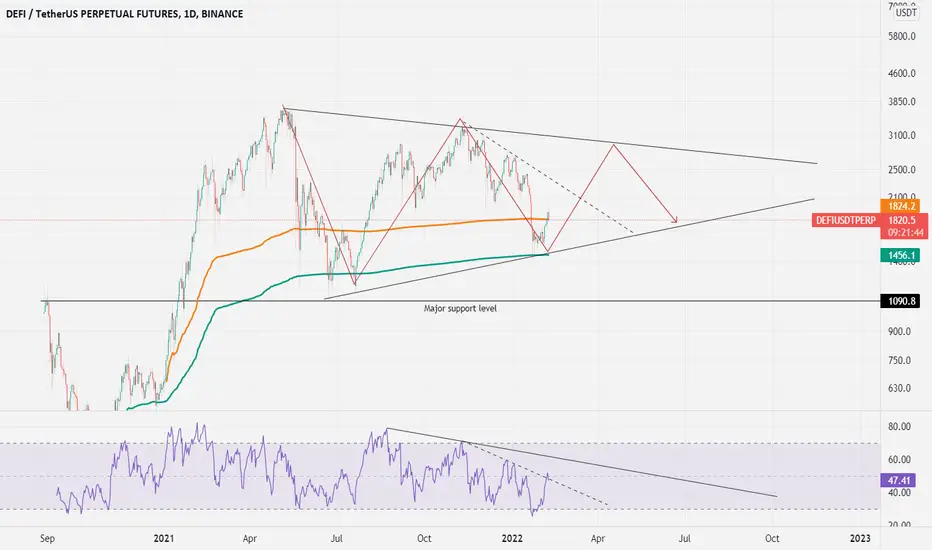
On my latest post, I mentioned that 1900 usdt was an important area to watch and which we were rejected.
On this set up, we can see that DEFI/USDT is forming a triangle on the LOG chart.
The RSI shows that we will enter in a long period of consolidation(look at the descending trend lines), however we will have some excellent gains if we play it well.
When we see this chart, we can be bullish on the defi coins until we touch the upper line of the triangle which we will exit positions & wait and see.
Follow for more updates.
On this set up, we can see that DEFI/USDT is forming a triangle on the LOG chart.
The RSI shows that we will enter in a long period of consolidation(look at the descending trend lines), however we will have some excellent gains if we play it well.
When we see this chart, we can be bullish on the defi coins until we touch the upper line of the triangle which we will exit positions & wait and see.
Follow for more updates.

Penerbitan berkaitan
Penafian
Maklumat dan penerbitan adalah tidak bertujuan, dan tidak membentuk, nasihat atau cadangan kewangan, pelaburan, dagangan atau jenis lain yang diberikan atau disahkan oleh TradingView. Baca lebih dalam Terma Penggunaan.
Penerbitan berkaitan
Penafian
Maklumat dan penerbitan adalah tidak bertujuan, dan tidak membentuk, nasihat atau cadangan kewangan, pelaburan, dagangan atau jenis lain yang diberikan atau disahkan oleh TradingView. Baca lebih dalam Terma Penggunaan.