
DIXON-Elliott Wave + Fib Confluence | Sell on Rise Setup
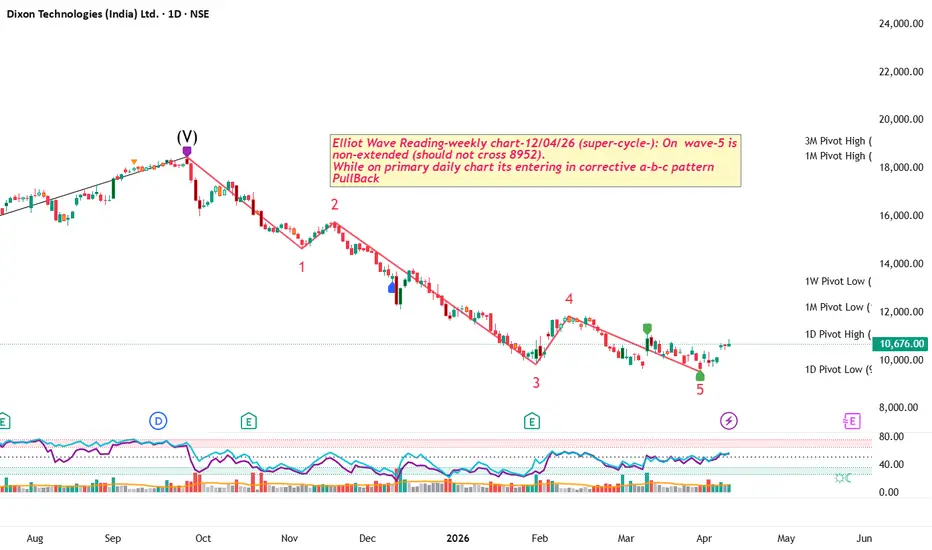
Dixon Technologies (India) Ltd; CMP: 10676.00; Tmeframe: Daily (with Weekly context)
🔍 Structure Insight
Weekly chart suggests Wave (V) TOP already in place
Price now in higher timeframe corrective phase (A-B-C)
Daily chart shows complete 5-wave impulsive decline
👉 Current bounce likely a corrective pullback, not trend reversal
📊 Key Levels to Watch
🔹 Support Zone: 9,600 – 10,000
🔹 Resistance Zones (Fib):
11,100 (0.236)
12,200 (0.382)
14,000 (0.5 – strong supply)
📈 Indicator View
RSI: Recovering from oversold → supports bounce
MACD: Early bullish crossover → short-term momentum
Volume: No strong accumulation yet
🎯 Trading Plan
👉 Bias: SELL ON RISE
🔺 Pullback expected towards: 11,100 – 12,300
🔻 Downside continuation likely after rejection
⚠️ Invalidation
Sustained breakout above 12,500 – 13,000
→ Can shift structure to bullish reversal
🧠 Conclusion
📉 Trend: Bearish (Corrective Phase Ongoing)
🔁 Move: Relief Rally in Progress
🎯 Strategy: Wait for rise, then short
📌 Thanks a ton for checking out my idea! Hope it sparked some value for you.
🙏 Follow for more insights
👍 Boost if you found it helpful
✍️ Drop a comment with your thoughts below!
🔍 Structure Insight
Weekly chart suggests Wave (V) TOP already in place
Price now in higher timeframe corrective phase (A-B-C)
Daily chart shows complete 5-wave impulsive decline
👉 Current bounce likely a corrective pullback, not trend reversal
📊 Key Levels to Watch
🔹 Support Zone: 9,600 – 10,000
🔹 Resistance Zones (Fib):
11,100 (0.236)
12,200 (0.382)
14,000 (0.5 – strong supply)
📈 Indicator View
RSI: Recovering from oversold → supports bounce
MACD: Early bullish crossover → short-term momentum
Volume: No strong accumulation yet
🎯 Trading Plan
👉 Bias: SELL ON RISE
🔺 Pullback expected towards: 11,100 – 12,300
🔻 Downside continuation likely after rejection
⚠️ Invalidation
Sustained breakout above 12,500 – 13,000
→ Can shift structure to bullish reversal
🧠 Conclusion
📉 Trend: Bearish (Corrective Phase Ongoing)
🔁 Move: Relief Rally in Progress
🎯 Strategy: Wait for rise, then short
📌 Thanks a ton for checking out my idea! Hope it sparked some value for you.
🙏 Follow for more insights
👍 Boost if you found it helpful
✍️ Drop a comment with your thoughts below!
Dagangan aktif
The earlier view anticipated a relief rally towards the ₹11,100–12,300 zone before the next directional move.✅ Stock has now reached the projected resistance area and is trading around ₹12,700–13,000.
⚠️ This was also the key invalidation zone highlighted earlier. A sustained move above ₹13,000 would negate the bearish corrective structure and signal a potential trend reversal.
📈 Traders should closely monitor price action here. The next move from this zone will determine whether Dixon resumes its correction or transitions into a fresh bullish phase.
Dagangan ditutup secara manual
Our view on Dixon Technologies has played out exactly as anticipated. 🎯📅 Initial Recommendation (Apr 12):
We highlighted that the stock was in a higher-timeframe corrective phase and advised "Sell on Rise", expecting a relief rally towards ₹11,100–12,300 before the next directional move.
📅 Update (Jun 18):
As projected, Dixon rallied into the ₹12,700–13,000 resistance zone, which was also identified as the key invalidation level for the bearish structure.
✅ Trade Outcome:
The resistance zone was successfully achieved, and the trade objective has been met. Now the structure has turned bullish.

Join The Crocodile Strategy for timely market updates, swing trade setups, technical analysis & quick market insights.
whatsapp.com/channel/0029Vb6zQU1DDmFMeeYP7g0w
whatsapp.com/channel/0029Vb6zQU1DDmFMeeYP7g0w
Penerbitan berkaitan
Penafian
Maklumat dan penerbitan adalah tidak bertujuan, dan tidak membentuk, nasihat atau cadangan kewangan, pelaburan, dagangan atau jenis lain yang diberikan atau disahkan oleh TradingView. Baca lebih dalam Terma Penggunaan.
Join The Crocodile Strategy for timely market updates, swing trade setups, technical analysis & quick market insights.
whatsapp.com/channel/0029Vb6zQU1DDmFMeeYP7g0w
whatsapp.com/channel/0029Vb6zQU1DDmFMeeYP7g0w
Penerbitan berkaitan
Penafian
Maklumat dan penerbitan adalah tidak bertujuan, dan tidak membentuk, nasihat atau cadangan kewangan, pelaburan, dagangan atau jenis lain yang diberikan atau disahkan oleh TradingView. Baca lebih dalam Terma Penggunaan.