
📊 Current Context
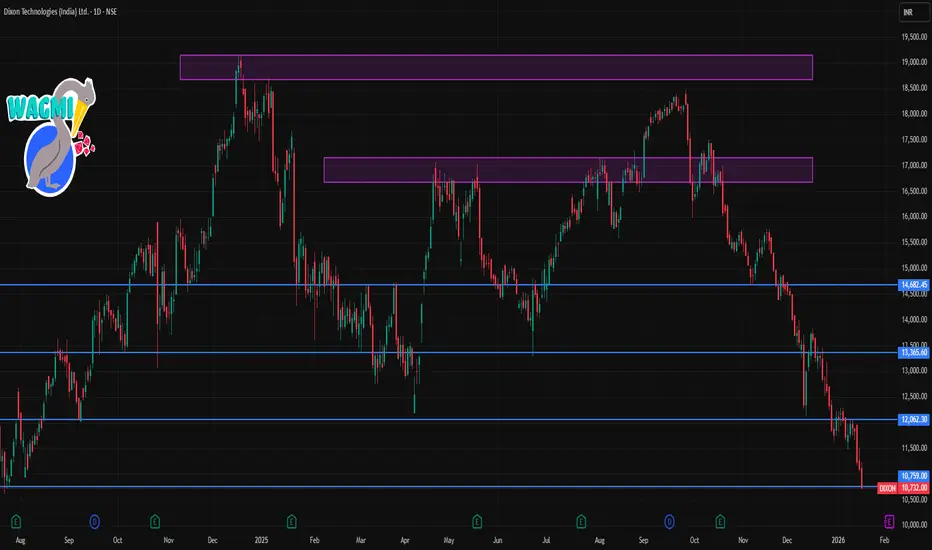
Latest traded price around ₹10,700 – ₹10,750 on NSE (recent price decline)
The stock is trading below major short-term moving averages, indicating short-term bearish bias.
🧠 Daily Pivot‑Based Levels (1‑Day Timeframe)
📈 Resistance (Upside)
R1: ≈ ₹11,401
R2: ≈ ₹11,699
R3: ≈ ₹11,872
(Levels from pivot analysis which traders use for intraday S/R monitoring)
📉 Support (Downside)
S1: ≈ ₹10,930
S2: ≈ ₹10,757
S3: ≈ ₹10,459
(Key intraday support zones where buyers may step in)
👉 Pivot (Daily Center): ~ ₹11,228 – above/below this helps judge bullish/bearish pressure.
📌 Short‑Term Technical Signals
RSI in oversold/weak territory — suggests momentum is on the downside and short‑term sellers are in control.
Price trading below 5, 10, 20, 50, 100, 200 SMAs/EMAs — a bearish multi‑MA structure on the daily chart.
Implication: On a 1‑day chart, the trend is weak/sloping lower until price breaks above near‑term resistances.
🧯 Short‑Term Trading Insight
Bearish bias: With price below key averages & oversold momentum, short‑term traders often look for lower‑high rallies to fade rather than long‑only entries.
Watch S1/S2 aggressively: If these fail, next support zones (S2/S3) become focus for intraday pullbacks.
Latest traded price around ₹10,700 – ₹10,750 on NSE (recent price decline)
The stock is trading below major short-term moving averages, indicating short-term bearish bias.
🧠 Daily Pivot‑Based Levels (1‑Day Timeframe)
📈 Resistance (Upside)
R1: ≈ ₹11,401
R2: ≈ ₹11,699
R3: ≈ ₹11,872
(Levels from pivot analysis which traders use for intraday S/R monitoring)
📉 Support (Downside)
S1: ≈ ₹10,930
S2: ≈ ₹10,757
S3: ≈ ₹10,459
(Key intraday support zones where buyers may step in)
👉 Pivot (Daily Center): ~ ₹11,228 – above/below this helps judge bullish/bearish pressure.
📌 Short‑Term Technical Signals
RSI in oversold/weak territory — suggests momentum is on the downside and short‑term sellers are in control.
Price trading below 5, 10, 20, 50, 100, 200 SMAs/EMAs — a bearish multi‑MA structure on the daily chart.
Implication: On a 1‑day chart, the trend is weak/sloping lower until price breaks above near‑term resistances.
🧯 Short‑Term Trading Insight
Bearish bias: With price below key averages & oversold momentum, short‑term traders often look for lower‑high rallies to fade rather than long‑only entries.
Watch S1/S2 aggressively: If these fail, next support zones (S2/S3) become focus for intraday pullbacks.

Contact Knowledgehub for a detailed consultation: Dm on WhatsApp: [wa.link/a2o0kz]-
Phone No: [+91 93102 26243]-
Email: [tradingviewknowledgehub@gmail.com]---
-- Let’s achieve success together!
Phone No: [+91 93102 26243]-
Email: [tradingviewknowledgehub@gmail.com]---
-- Let’s achieve success together!
Penerbitan berkaitan
Penafian
Maklumat dan penerbitan adalah tidak bertujuan, dan tidak membentuk, nasihat atau cadangan kewangan, pelaburan, dagangan atau jenis lain yang diberikan atau disahkan oleh TradingView. Baca lebih dalam Terma Penggunaan.
Contact Knowledgehub for a detailed consultation: Dm on WhatsApp: [wa.link/a2o0kz]-
Phone No: [+91 93102 26243]-
Email: [tradingviewknowledgehub@gmail.com]---
-- Let’s achieve success together!
Phone No: [+91 93102 26243]-
Email: [tradingviewknowledgehub@gmail.com]---
-- Let’s achieve success together!
Penerbitan berkaitan
Penafian
Maklumat dan penerbitan adalah tidak bertujuan, dan tidak membentuk, nasihat atau cadangan kewangan, pelaburan, dagangan atau jenis lain yang diberikan atau disahkan oleh TradingView. Baca lebih dalam Terma Penggunaan.