
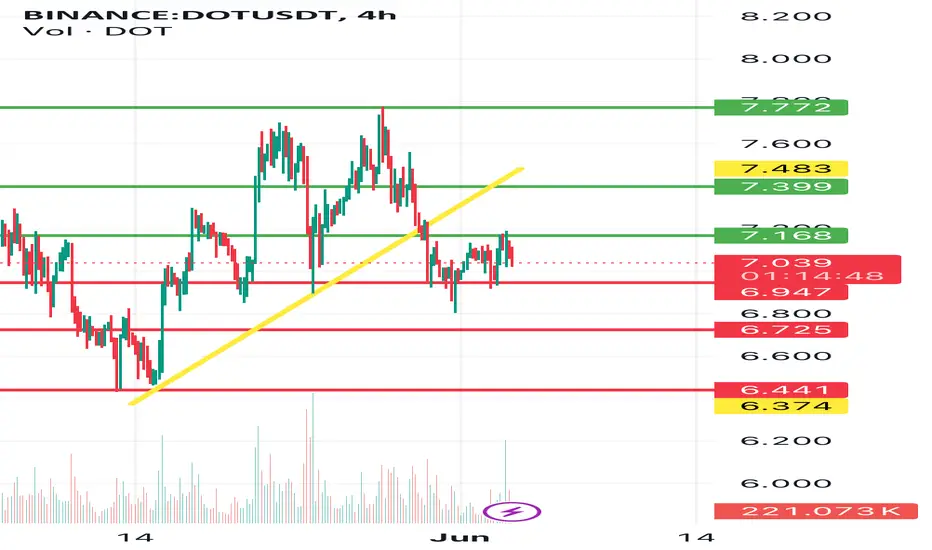
Hello everyone, welcome to a quick review of the DOT chart. As we can see on the chart, we are locally moving along a downward trend line. After unfolding the fib retracement grid, you can see the price staying above the strong support level at $7.04, then the support level at $6.73, and then the strong support level at $6.44. Looking the other way, you can similarly identify resistance points. And here we can see the resistance at the level of $7.17, the next important place is $7.40, after which we will be able to see an upward movement towards the resistance at the price of $7.77.

Penafian
Maklumat dan penerbitan adalah tidak bertujuan, dan tidak membentuk, nasihat atau cadangan kewangan, pelaburan, dagangan atau jenis lain yang diberikan atau disahkan oleh TradingView. Baca lebih dalam Terma Penggunaan.
Penafian
Maklumat dan penerbitan adalah tidak bertujuan, dan tidak membentuk, nasihat atau cadangan kewangan, pelaburan, dagangan atau jenis lain yang diberikan atau disahkan oleh TradingView. Baca lebih dalam Terma Penggunaan.