
DXY Index Can Go Up by Classical Technical Analysis Pattern🚀
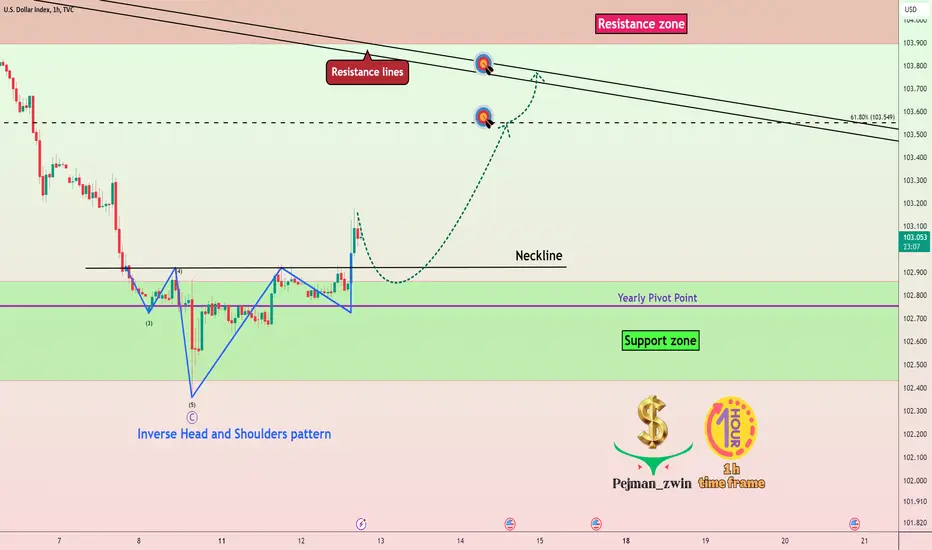
🏃♂️The DXY Index is moving in the 🟢Support zone($102.87-$102.43)🟢.
📈 Regarding Classical Technical Analysis, the dollar index has successfully formed an Inverse Head and Shoulders pattern.
🌊According to the theory of Elliott waves, the dollar index has completed a Zigzag correction(ABC/5-3-5) in the 🟢Support zone($102.87-$102.43)🟢.
🔔I expect the DXY Index to rise to at least the 61.8% Fibonacci level and Resistance lines.
U.S.Dollar Currency Index ( DXYUSD ) Analyze, 1-hour time frame⏰.
Do not forget to put Stop loss for your positions (For every position you want to open).
Please follow your strategy; this is just my Idea, and I will gladly see your ideas in this post.
Please do not forget the ✅' like'✅ button 🙏😊 & Share it with your friends; thanks, and Trade safe.
📈 Regarding Classical Technical Analysis, the dollar index has successfully formed an Inverse Head and Shoulders pattern.
🌊According to the theory of Elliott waves, the dollar index has completed a Zigzag correction(ABC/5-3-5) in the 🟢Support zone($102.87-$102.43)🟢.
🔔I expect the DXY Index to rise to at least the 61.8% Fibonacci level and Resistance lines.
U.S.Dollar Currency Index ( DXYUSD ) Analyze, 1-hour time frame⏰.
Do not forget to put Stop loss for your positions (For every position you want to open).
Please follow your strategy; this is just my Idea, and I will gladly see your ideas in this post.
Please do not forget the ✅' like'✅ button 🙏😊 & Share it with your friends; thanks, and Trade safe.
Dagangan aktif
Nota
✅Running well✅Dagangan ditutup: sasaran tercapai

ProTrader365 | Crypto & Forex Analyst
8+ Years Experience • Elliott Wave • Volume & Order Flow
Free Signals, Market Analysis & Education
Explore our community & VIP services:
linktr.ee/ProTrader365
8+ Years Experience • Elliott Wave • Volume & Order Flow
Free Signals, Market Analysis & Education
Explore our community & VIP services:
linktr.ee/ProTrader365
Penerbitan berkaitan
Penafian
Maklumat dan penerbitan adalah tidak bertujuan, dan tidak membentuk, nasihat atau cadangan kewangan, pelaburan, dagangan atau jenis lain yang diberikan atau disahkan oleh TradingView. Baca lebih dalam Terma Penggunaan.
ProTrader365 | Crypto & Forex Analyst
8+ Years Experience • Elliott Wave • Volume & Order Flow
Free Signals, Market Analysis & Education
Explore our community & VIP services:
linktr.ee/ProTrader365
8+ Years Experience • Elliott Wave • Volume & Order Flow
Free Signals, Market Analysis & Education
Explore our community & VIP services:
linktr.ee/ProTrader365
Penerbitan berkaitan
Penafian
Maklumat dan penerbitan adalah tidak bertujuan, dan tidak membentuk, nasihat atau cadangan kewangan, pelaburan, dagangan atau jenis lain yang diberikan atau disahkan oleh TradingView. Baca lebih dalam Terma Penggunaan.