
DXY Bullish Recovery from Support – Eyes on 101.02 Resistance
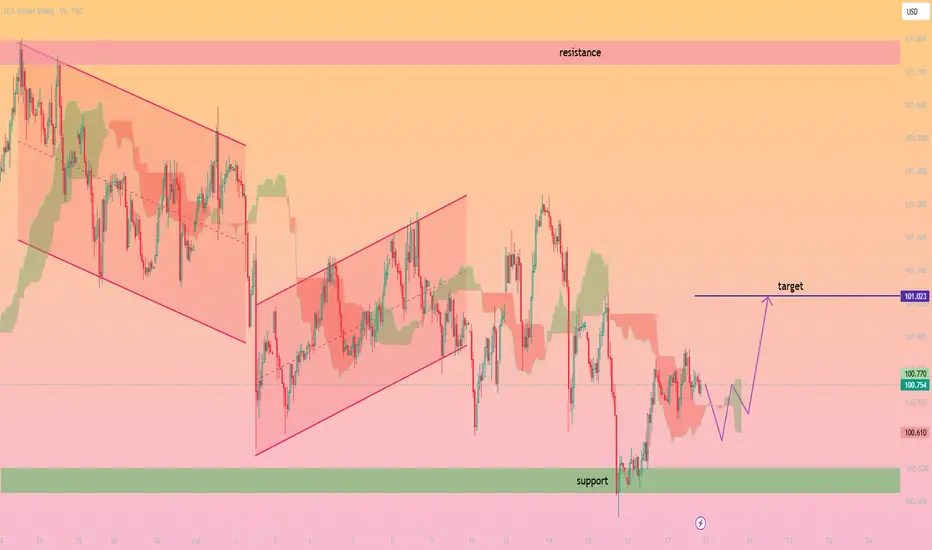
The **U.S. Dollar Index (DXY)** is showing signs of a potential bullish recovery after finding strong support around the **100.45–100.50** demand zone. Price recently bounced from this key support area and is attempting to stabilize above the **100.70** level.
Although the broader trend has been bearish, the current structure suggests buyers are defending the support zone. The Ichimoku Cloud indicates that momentum is still mixed, but a sustained move above the cloud and nearby resistance could confirm a bullish continuation.
The projected path on the chart suggests a minor pullback toward the support region before buyers regain control and push the index higher. A successful hold above support may open the door for a rally toward the next resistance level.
### **Target:**
* **Primary Target:** **101.02**
* **Support Zone:** **100.45–100.50**
* **Confirmation Level:** **100.80–100.90**
* **Major Resistance:** **101.75–101.80**
**Trading Idea:**
As long as DXY remains above the **100.45 support**, the bullish recovery scenario remains valid. A confirmed breakout above **100.90** would increase the probability of price reaching the **101.02** target, while a break below support would invalidate the bullish outlook.
Dagangan aktif
activeDagangan ditutup: sasaran tercapai
my given target is achieved
join this channel for free signals
t.me/+EM2OGkUHG5g5MjA0
join this for trading education purpose
t.me/+EM2OGkUHG5g5MjA0
t.me/+EM2OGkUHG5g5MjA0
join this for trading education purpose
t.me/+EM2OGkUHG5g5MjA0
Penerbitan berkaitan
Penafian
Maklumat dan penerbitan adalah tidak bertujuan, dan tidak membentuk, nasihat atau cadangan kewangan, pelaburan, dagangan atau jenis lain yang diberikan atau disahkan oleh TradingView. Baca lebih dalam Terma Penggunaan.
join this channel for free signals
t.me/+EM2OGkUHG5g5MjA0
join this for trading education purpose
t.me/+EM2OGkUHG5g5MjA0
t.me/+EM2OGkUHG5g5MjA0
join this for trading education purpose
t.me/+EM2OGkUHG5g5MjA0
Penerbitan berkaitan
Penafian
Maklumat dan penerbitan adalah tidak bertujuan, dan tidak membentuk, nasihat atau cadangan kewangan, pelaburan, dagangan atau jenis lain yang diberikan atau disahkan oleh TradingView. Baca lebih dalam Terma Penggunaan.