
ENGINERSIN Multi-Year Structural Breakout on Monthly Chart
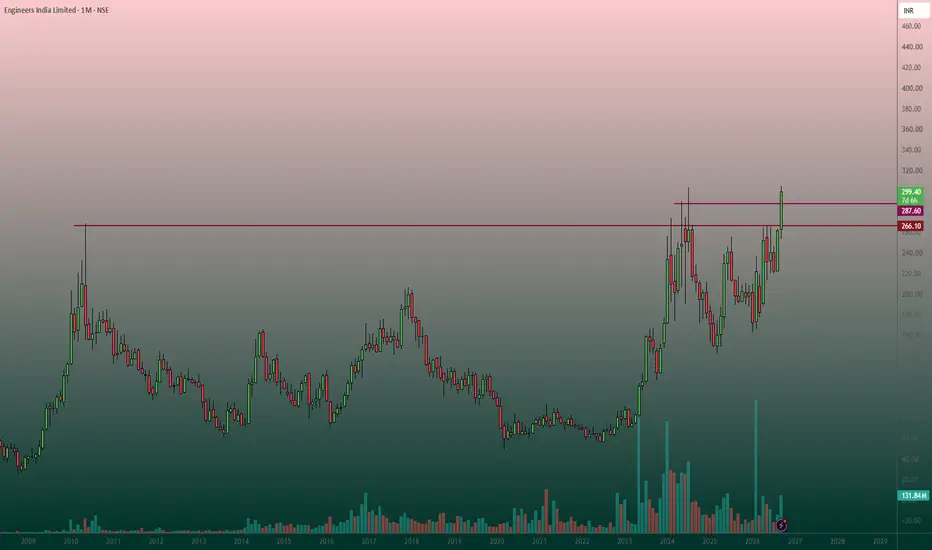
The monthly chart for Engineers India Limited presents a compelling long-term bullish setup following a significant structural breakout.
Technical Analysis:
The stock has spent several years consolidating below major historical resistance zones.
As highlighted on the chart:
Red Line (266.10): Represents a critical multi-year historical resistance level.
Purple Line (287.60): Represents a more recent intermediate swing high resistance.
Recently, the price action has demonstrated strong bullish momentum, decisively pushing past both of these resistance levels to trade near 300.25.
This breakout on a higher (monthly) timeframe, accompanied by noticeable volume spikes in recent months, indicates potential long-term accumulation and a strong continuation of the upward trend.
Trading Plan:
Entry Point: Accumulation can be considered at the Current Market Price around 300.
A more conservative approach would be to wait for and buy on a potential retest of the breakout zone between 287.60 and 266.10.
Target: Based on the depth of the multi-year consolidation structure, the initial measured move suggests long-term targets in the 380 – 400 zone, with a secondary extended target around the 450 level.
Stop Loss: To effectively manage risk, a stop loss should be placed below the major structural support.
A confirmed weekly or monthly candle close below the 255 – 260 level would invalidate this specific breakout thesis.
Technical Analysis:
The stock has spent several years consolidating below major historical resistance zones.
As highlighted on the chart:
Red Line (266.10): Represents a critical multi-year historical resistance level.
Purple Line (287.60): Represents a more recent intermediate swing high resistance.
Recently, the price action has demonstrated strong bullish momentum, decisively pushing past both of these resistance levels to trade near 300.25.
This breakout on a higher (monthly) timeframe, accompanied by noticeable volume spikes in recent months, indicates potential long-term accumulation and a strong continuation of the upward trend.
Trading Plan:
Entry Point: Accumulation can be considered at the Current Market Price around 300.
A more conservative approach would be to wait for and buy on a potential retest of the breakout zone between 287.60 and 266.10.
Target: Based on the depth of the multi-year consolidation structure, the initial measured move suggests long-term targets in the 380 – 400 zone, with a secondary extended target around the 450 level.
Stop Loss: To effectively manage risk, a stop loss should be placed below the major structural support.
A confirmed weekly or monthly candle close below the 255 – 260 level would invalidate this specific breakout thesis.
Dagangan ditutup: hentian tercapai
Stoploss hit..
Penafian
Maklumat dan penerbitan adalah tidak bertujuan, dan tidak membentuk, nasihat atau cadangan kewangan, pelaburan, dagangan atau jenis lain yang diberikan atau disahkan oleh TradingView. Baca lebih dalam Terma Penggunaan.
Penafian
Maklumat dan penerbitan adalah tidak bertujuan, dan tidak membentuk, nasihat atau cadangan kewangan, pelaburan, dagangan atau jenis lain yang diberikan atau disahkan oleh TradingView. Baca lebih dalam Terma Penggunaan.