
I haven't seen a chart like this.
Overbought conditions tend to go to extremely high levels. ( RSI<30 oversold & RSI>70 overbought).
Technical Analysis:
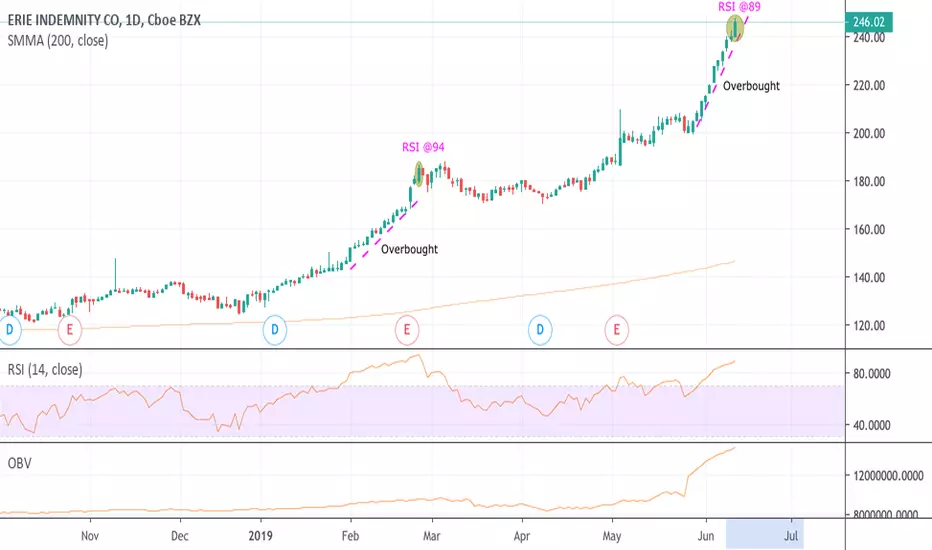
I see a positive divergence between the bull rally from February (marked in the chart) and this June bull rally, is that the OBV is 50% higher!
RSI(10) 89, last rally ended on RSI(10) @94.
Check out the chart for more information.
Overbought conditions tend to go to extremely high levels. ( RSI<30 oversold & RSI>70 overbought).
Technical Analysis:
I see a positive divergence between the bull rally from February (marked in the chart) and this June bull rally, is that the OBV is 50% higher!
RSI(10) 89, last rally ended on RSI(10) @94.
Check out the chart for more information.

Penafian
Maklumat dan penerbitan adalah tidak bertujuan, dan tidak membentuk, nasihat atau cadangan kewangan, pelaburan, dagangan atau jenis lain yang diberikan atau disahkan oleh TradingView. Baca lebih dalam Terma Penggunaan.
Penafian
Maklumat dan penerbitan adalah tidak bertujuan, dan tidak membentuk, nasihat atau cadangan kewangan, pelaburan, dagangan atau jenis lain yang diberikan atau disahkan oleh TradingView. Baca lebih dalam Terma Penggunaan.