
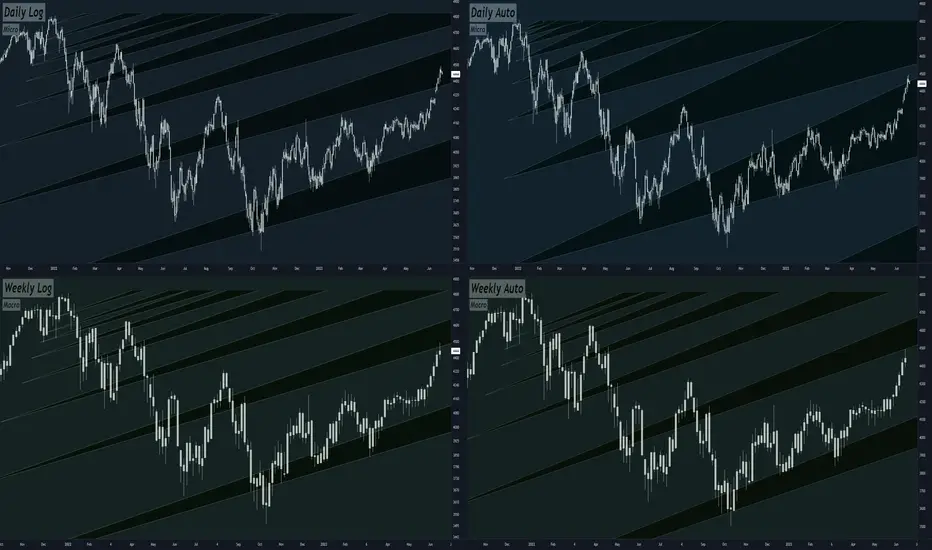
-Here's my quad chart analysis of ES1!, the S&P500 futures index, displaying striking accuracy with Fibonacci retracements.
-The top two boxes present micro charts on daily tf's, showing recent Fibonacci-based peaks and troughs. The bottom two are weekly schematics on 3 Day tf's, revealing longer-term trends obediently following Fib levels.
-KEEP IN MIND THE BOTTOM TWO "WEEKLY" ARE ACTUALLY 3 DAY CHARTS MAPPING A WEEKLY SCHEMATIC
-This alignment suggests the Market Maker's playful maneuvers before an anticipated significant move. Based on the patterns, I hypothesize a considerable downtrend on the horizon for the S&P Futures Index (ES1!).
-Remember, market predictions aren't set in stone and require vigilance. However... dump city here we come.
-The top two boxes present micro charts on daily tf's, showing recent Fibonacci-based peaks and troughs. The bottom two are weekly schematics on 3 Day tf's, revealing longer-term trends obediently following Fib levels.
-KEEP IN MIND THE BOTTOM TWO "WEEKLY" ARE ACTUALLY 3 DAY CHARTS MAPPING A WEEKLY SCHEMATIC
-This alignment suggests the Market Maker's playful maneuvers before an anticipated significant move. Based on the patterns, I hypothesize a considerable downtrend on the horizon for the S&P Futures Index (ES1!).
-Remember, market predictions aren't set in stone and require vigilance. However... dump city here we come.
Nota
Nota

Penerbitan berkaitan
Penafian
Maklumat dan penerbitan adalah tidak bertujuan, dan tidak membentuk, nasihat atau cadangan kewangan, pelaburan, dagangan atau jenis lain yang diberikan atau disahkan oleh TradingView. Baca lebih dalam Terma Penggunaan.
Penerbitan berkaitan
Penafian
Maklumat dan penerbitan adalah tidak bertujuan, dan tidak membentuk, nasihat atau cadangan kewangan, pelaburan, dagangan atau jenis lain yang diberikan atau disahkan oleh TradingView. Baca lebih dalam Terma Penggunaan.