
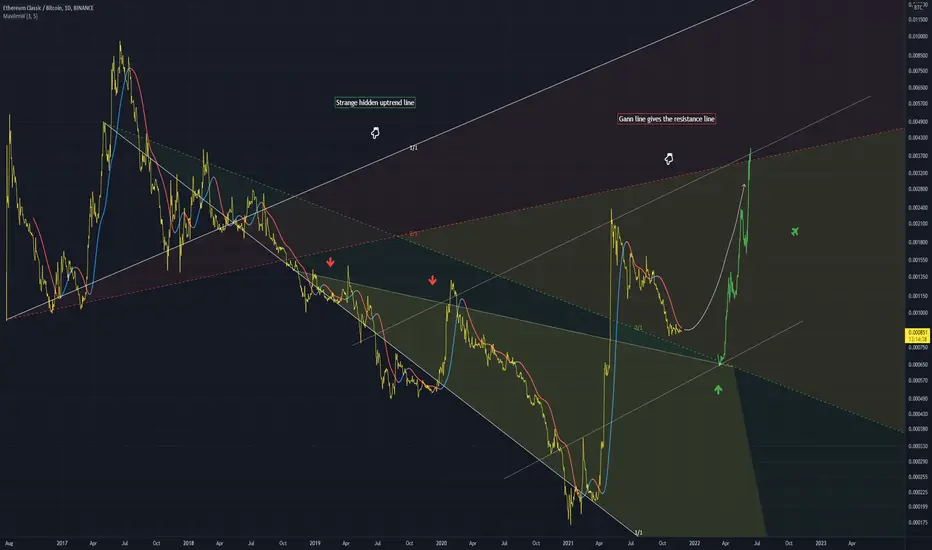
Using the Gann tool we can plot down trends and uptrends
Plotting both, it gives a support point for price, and also a resistance point
I expect a bounce off the support from the downtrend Gann line at some point
This bounce will hit the resistance Gann line (in red)
A large up channel can also be plotted if you place this up move (dotted line)
The indicator is what I expect will occur as price moves (in white)

Penafian
Maklumat dan penerbitan adalah tidak bertujuan, dan tidak membentuk, nasihat atau cadangan kewangan, pelaburan, dagangan atau jenis lain yang diberikan atau disahkan oleh TradingView. Baca lebih dalam Terma Penggunaan.
Penafian
Maklumat dan penerbitan adalah tidak bertujuan, dan tidak membentuk, nasihat atau cadangan kewangan, pelaburan, dagangan atau jenis lain yang diberikan atau disahkan oleh TradingView. Baca lebih dalam Terma Penggunaan.