
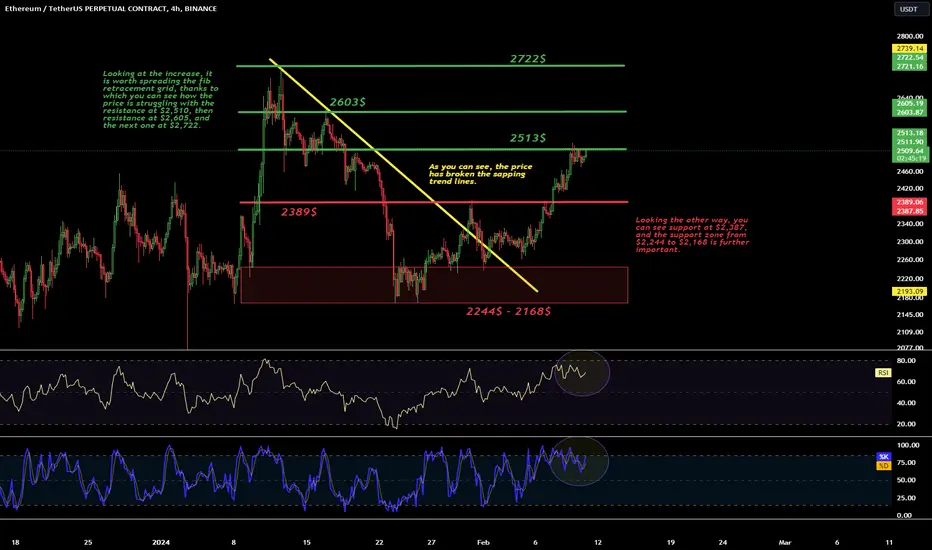
Hello everyone, let's take a look at the BTC to USDT chart on a four-hour time frame. As you can see, the price has broken the sapping trend lines.
Looking at the increase, it is worth spreading the fib retracement grid, thanks to which you can see how the price is struggling with the resistance at $2,510, then resistance at $2,605, and the next one at $2,722.
Looking the other way, you can see support at $2,387, and the support zone from $2,244 to $2,168 is further important.
The RSI indicator, similarly to the STOCH indicator, shows a movement towards the upper limit, which may lead to a desire to recover and a price drop.
Looking at the increase, it is worth spreading the fib retracement grid, thanks to which you can see how the price is struggling with the resistance at $2,510, then resistance at $2,605, and the next one at $2,722.
Looking the other way, you can see support at $2,387, and the support zone from $2,244 to $2,168 is further important.
The RSI indicator, similarly to the STOCH indicator, shows a movement towards the upper limit, which may lead to a desire to recover and a price drop.

Penafian
Maklumat dan penerbitan adalah tidak bertujuan, dan tidak membentuk, nasihat atau cadangan kewangan, pelaburan, dagangan atau jenis lain yang diberikan atau disahkan oleh TradingView. Baca lebih dalam Terma Penggunaan.
Penafian
Maklumat dan penerbitan adalah tidak bertujuan, dan tidak membentuk, nasihat atau cadangan kewangan, pelaburan, dagangan atau jenis lain yang diberikan atau disahkan oleh TradingView. Baca lebih dalam Terma Penggunaan.