
Ethereum (ETH) technical analysis:
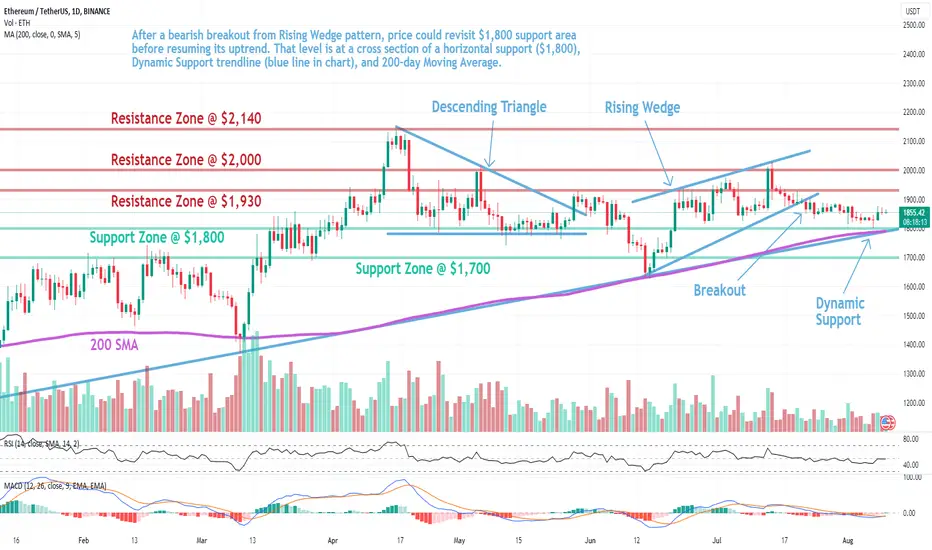
Trade setup: After a bearish breakout from Rising Wedge pattern, price could revisit $1,800 support area before resuming its uptrend. That level is at a cross section of a horizontal support ($1,800), Dynamic Support trendline (blue line in chart), and 200-day Moving Average.
Trend: Neutral on Short-Term basis, Uptrend on Medium-Term basis and Downtrend on Long-Term basis.
Momentum is Mixed as MACD Line is below MACD Signal Line (Bearish) but RSI ~ 50 (Neutral). MACD Histogram bars are rising, which suggests that momentum could be nearing another upswing.
Support and Resistance: Nearest Support Zone is $1,800 (previous resistance), then $1,700. The nearest Resistance Zone is $1,930, then $2,000 and $2,140.
Trade setup: After a bearish breakout from Rising Wedge pattern, price could revisit $1,800 support area before resuming its uptrend. That level is at a cross section of a horizontal support ($1,800), Dynamic Support trendline (blue line in chart), and 200-day Moving Average.
Trend: Neutral on Short-Term basis, Uptrend on Medium-Term basis and Downtrend on Long-Term basis.
Momentum is Mixed as MACD Line is below MACD Signal Line (Bearish) but RSI ~ 50 (Neutral). MACD Histogram bars are rising, which suggests that momentum could be nearing another upswing.
Support and Resistance: Nearest Support Zone is $1,800 (previous resistance), then $1,700. The nearest Resistance Zone is $1,930, then $2,000 and $2,140.

Penafian
Maklumat dan penerbitan adalah tidak bertujuan, dan tidak membentuk, nasihat atau cadangan kewangan, pelaburan, dagangan atau jenis lain yang diberikan atau disahkan oleh TradingView. Baca lebih dalam Terma Penggunaan.
Penafian
Maklumat dan penerbitan adalah tidak bertujuan, dan tidak membentuk, nasihat atau cadangan kewangan, pelaburan, dagangan atau jenis lain yang diberikan atau disahkan oleh TradingView. Baca lebih dalam Terma Penggunaan.