

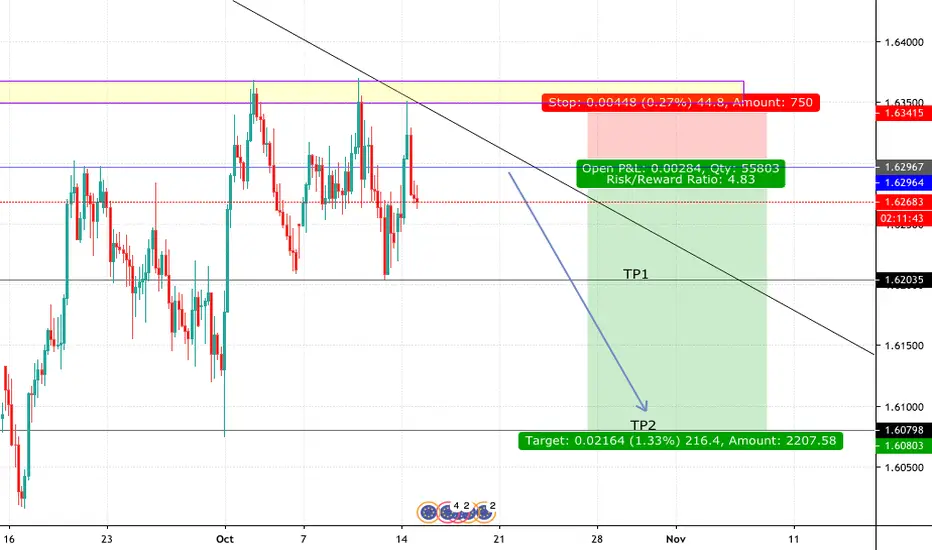
As shown, in the yellow area we can observe price resistance, where the market failed to break through each wick and currently has started to drop. On the daily chart, we can observe a change of trend - proceeding downtrend and as the market retraces, we look for sells.
Change of trend - 3 wicks that show resistance - pullback on the daily chart.
A blue line has been marked where you can enter the trade, as the price has been dropping and jumping on a mid trade wouldn't be efficient. Look for pullbacks and enter for a sell.
Change of trend - 3 wicks that show resistance - pullback on the daily chart.
A blue line has been marked where you can enter the trade, as the price has been dropping and jumping on a mid trade wouldn't be efficient. Look for pullbacks and enter for a sell.

Penafian
Maklumat dan penerbitan adalah tidak bertujuan, dan tidak membentuk, nasihat atau cadangan kewangan, pelaburan, dagangan atau jenis lain yang diberikan atau disahkan oleh TradingView. Baca lebih dalam Terma Penggunaan.
Penafian
Maklumat dan penerbitan adalah tidak bertujuan, dan tidak membentuk, nasihat atau cadangan kewangan, pelaburan, dagangan atau jenis lain yang diberikan atau disahkan oleh TradingView. Baca lebih dalam Terma Penggunaan.