

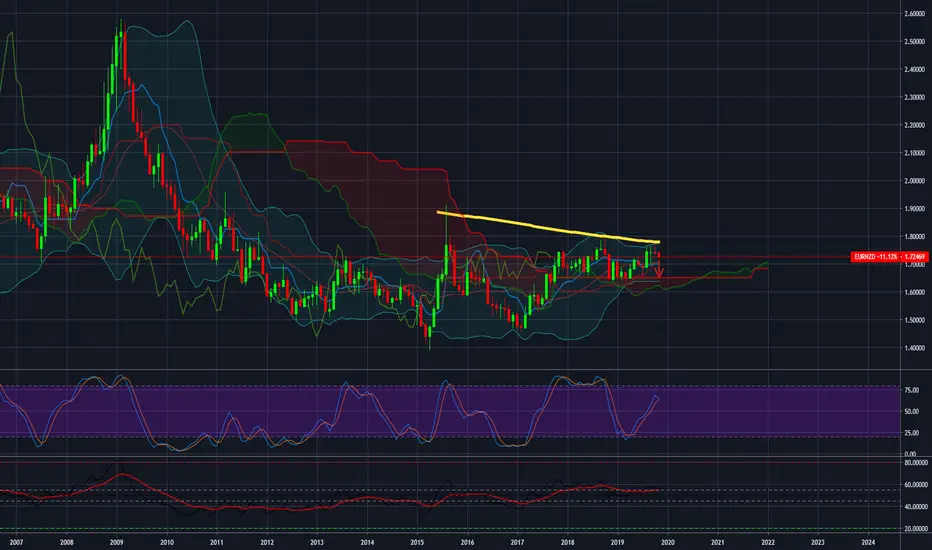
We usually prefer to analyze graphs in D1 but this pattern in the monthly graph forces us to write about it.
2 Doji candlestick symbolizing a trend ending (to confirm the current candle theory should close in red ... got off to a good start)
The 200 moving average line synchronizes with the resistance line at 1.7760.
This is the third time eurnzd has touched the average line and is responding to declines.
Target: 1.7110
2 Doji candlestick symbolizing a trend ending (to confirm the current candle theory should close in red ... got off to a good start)
The 200 moving average line synchronizes with the resistance line at 1.7760.
This is the third time eurnzd has touched the average line and is responding to declines.
Target: 1.7110

Penafian
Maklumat dan penerbitan adalah tidak bertujuan, dan tidak membentuk, nasihat atau cadangan kewangan, pelaburan, dagangan atau jenis lain yang diberikan atau disahkan oleh TradingView. Baca lebih dalam Terma Penggunaan.
Penafian
Maklumat dan penerbitan adalah tidak bertujuan, dan tidak membentuk, nasihat atau cadangan kewangan, pelaburan, dagangan atau jenis lain yang diberikan atau disahkan oleh TradingView. Baca lebih dalam Terma Penggunaan.