

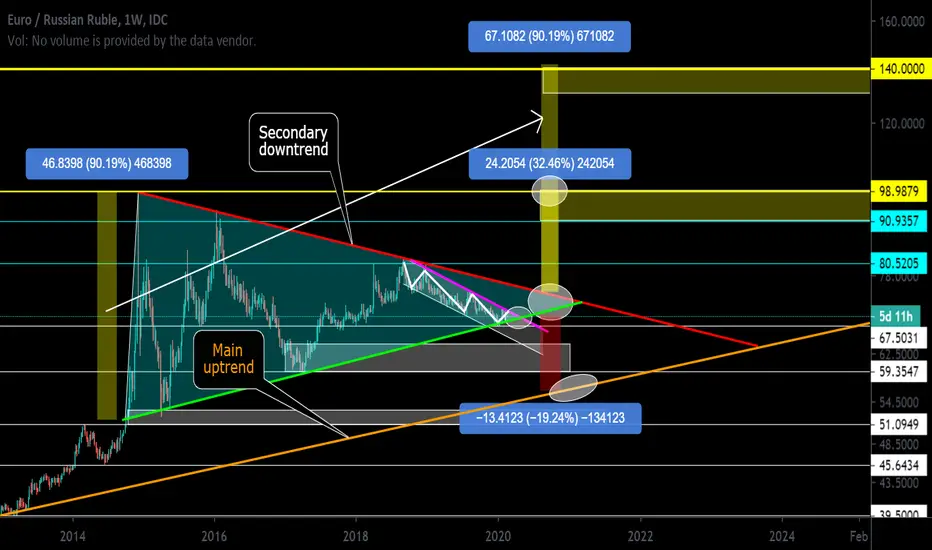
On the graph, we see a symmetrical triangle that has been forming since 2014.
A symmetrical triangle is a figure of uncertainty. The percentage of up / down in the ratio of 50/50. The price is clamped. This year will be the denouement of the global movement.
Now the price is in a downward channel, have come close to the trend line of the triangle (green line), which will act as a support.
Pay attention to the main trend and secondary trends. I graphically depicted. Particular attention to the main trend (orange trend line), not paying attention to the local downtrend now, we are in an uptrend.
Breaking down a downtrend secondary trend (triangle resistance, red line) will mean a reversal of the local downtrend and the formation of a new uptrend. The full development of the potential of this triangle is 90%.
All the pivot zones on which the formation of one or another potential movement and target depends, I showed on the chart.
A symmetrical triangle is a figure of uncertainty. The percentage of up / down in the ratio of 50/50. The price is clamped. This year will be the denouement of the global movement.
Now the price is in a downward channel, have come close to the trend line of the triangle (green line), which will act as a support.
Pay attention to the main trend and secondary trends. I graphically depicted. Particular attention to the main trend (orange trend line), not paying attention to the local downtrend now, we are in an uptrend.
Breaking down a downtrend secondary trend (triangle resistance, red line) will mean a reversal of the local downtrend and the formation of a new uptrend. The full development of the potential of this triangle is 90%.
All the pivot zones on which the formation of one or another potential movement and target depends, I showed on the chart.
Nota
Dagangan ditutup: sasaran tercapai
2 target +18%
Dagangan ditutup: sasaran tercapai
After 10 days, a profit of 26%.
movement continues to 3 target
Dagangan ditutup: sasaran tercapai
The situation is now.
2 target achieved + 32%
Nota

✅ Telegram. Finance + Trading: t.me/+gk2yHfJL7sAzMjQy
✅ Telegram. Сrypto trading only: t.me/+eMcgaX7JjDo3ZTky
✅ Instagram: instagram.com/spartabtc_1318
✅ YouTube (Rus): goo.su/vpRzRa2
✅ Telegram. Сrypto trading only: t.me/+eMcgaX7JjDo3ZTky
✅ Instagram: instagram.com/spartabtc_1318
✅ YouTube (Rus): goo.su/vpRzRa2
Penafian
Maklumat dan penerbitan adalah tidak bertujuan, dan tidak membentuk, nasihat atau cadangan kewangan, pelaburan, dagangan atau jenis lain yang diberikan atau disahkan oleh TradingView. Baca lebih dalam Terma Penggunaan.
✅ Telegram. Finance + Trading: t.me/+gk2yHfJL7sAzMjQy
✅ Telegram. Сrypto trading only: t.me/+eMcgaX7JjDo3ZTky
✅ Instagram: instagram.com/spartabtc_1318
✅ YouTube (Rus): goo.su/vpRzRa2
✅ Telegram. Сrypto trading only: t.me/+eMcgaX7JjDo3ZTky
✅ Instagram: instagram.com/spartabtc_1318
✅ YouTube (Rus): goo.su/vpRzRa2
Penafian
Maklumat dan penerbitan adalah tidak bertujuan, dan tidak membentuk, nasihat atau cadangan kewangan, pelaburan, dagangan atau jenis lain yang diberikan atau disahkan oleh TradingView. Baca lebih dalam Terma Penggunaan.