
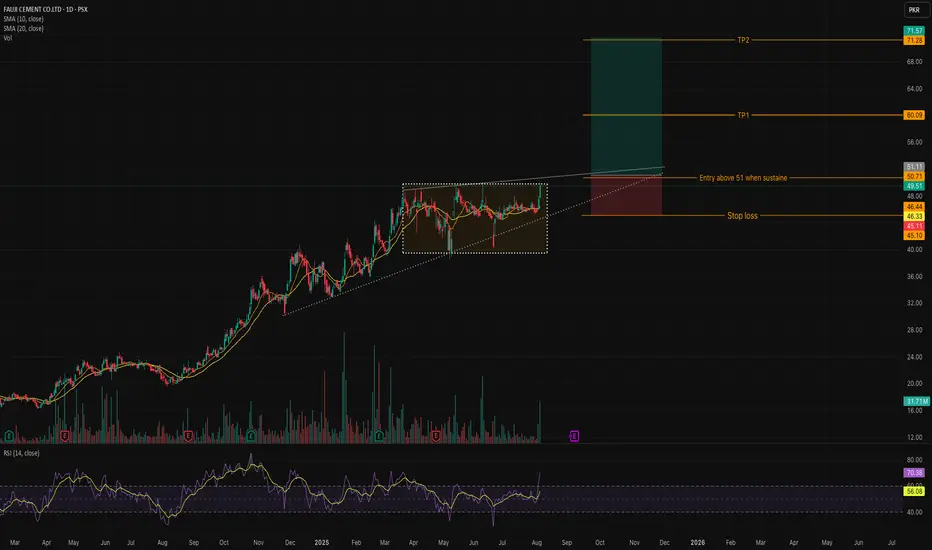
Pattern: Ascending Triangle | Timeframe: 1D | Sector: Cement
After weeks of consolidation, FCCL is finally knocking on the resistance door. With strong volume and momentum, a breakout could unlock serious upside potential! 📈
🔍 Setup Overview:
✅ Breakout Level: 51.11 – Key resistance to watch. Entry on sustained close above this level.
🟢 Current Price: 49.51 – Just below breakout zone.
💡 Indicators:
RSI at 70.38 – Entering overbought territory, showing bullish momentum.
SMA(10) and SMA(20) support the trend.
🎯 Trade Plan:
📥 Entry: Above 51.11 (on confirmed breakout)
🛑 Stop Loss: 45.10 – Below structure support and SMA cluster
🎯 Target 1 (TP1): 60.09
🎯 Target 2 (TP2): 71.57
This gives a strong risk-reward ratio, ideal for swing traders.
Dagangan aktif
TP1 hit, Trail your SL to breakeven, and ride for Tp2 
Penafian
Maklumat dan penerbitan adalah tidak bertujuan, dan tidak membentuk, nasihat atau cadangan kewangan, pelaburan, dagangan atau jenis lain yang diberikan atau disahkan oleh TradingView. Baca lebih dalam Terma Penggunaan.
Penafian
Maklumat dan penerbitan adalah tidak bertujuan, dan tidak membentuk, nasihat atau cadangan kewangan, pelaburan, dagangan atau jenis lain yang diberikan atau disahkan oleh TradingView. Baca lebih dalam Terma Penggunaan.