Panjang
FTM ANALYSIS
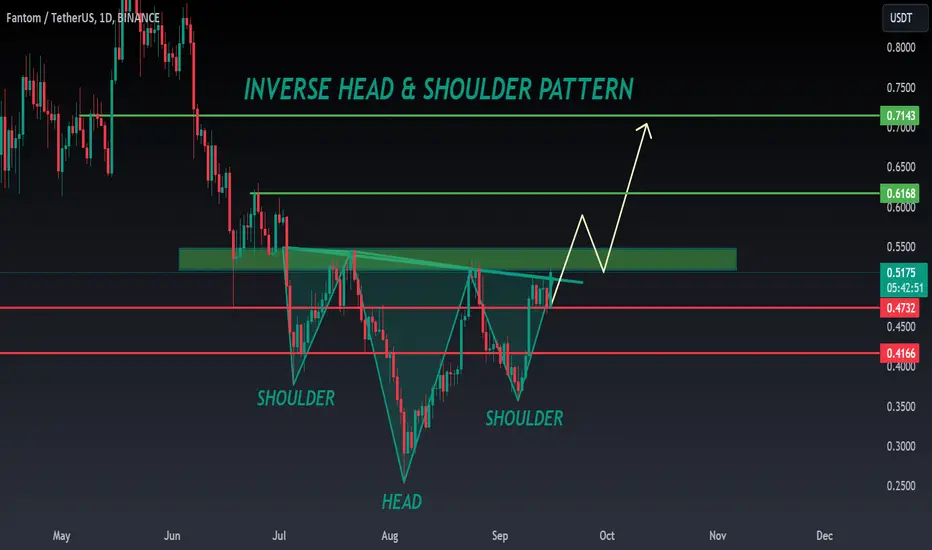
🚀#FTM Analysis : Pattern Formation
🔮As we can see in the chart of #FTM that there is a formation Inverse Head And Shoulder Pattern and it's a bullish pattern. If the candle closes above the neckline then a bullish move could be confirmed✅️
🔰Current Price: $0.5160
🎯 Target Price: $0.7140
⚡️What to do ?
👀Keep an eye on #FTM price action. We can trade according to the chart and make some profits⚡️⚡️
#FTM #Cryptocurrency #TechnicalAnalysis #DYOR
🔮As we can see in the chart of #FTM that there is a formation Inverse Head And Shoulder Pattern and it's a bullish pattern. If the candle closes above the neckline then a bullish move could be confirmed✅️
🔰Current Price: $0.5160
🎯 Target Price: $0.7140
⚡️What to do ?
👀Keep an eye on #FTM price action. We can trade according to the chart and make some profits⚡️⚡️
#FTM #Cryptocurrency #TechnicalAnalysis #DYOR

Penerbitan berkaitan
Penafian
Maklumat dan penerbitan adalah tidak bertujuan, dan tidak membentuk, nasihat atau cadangan kewangan, pelaburan, dagangan atau jenis lain yang diberikan atau disahkan oleh TradingView. Baca lebih dalam Terma Penggunaan.
Penerbitan berkaitan
Penafian
Maklumat dan penerbitan adalah tidak bertujuan, dan tidak membentuk, nasihat atau cadangan kewangan, pelaburan, dagangan atau jenis lain yang diberikan atau disahkan oleh TradingView. Baca lebih dalam Terma Penggunaan.