FTM
Hi,
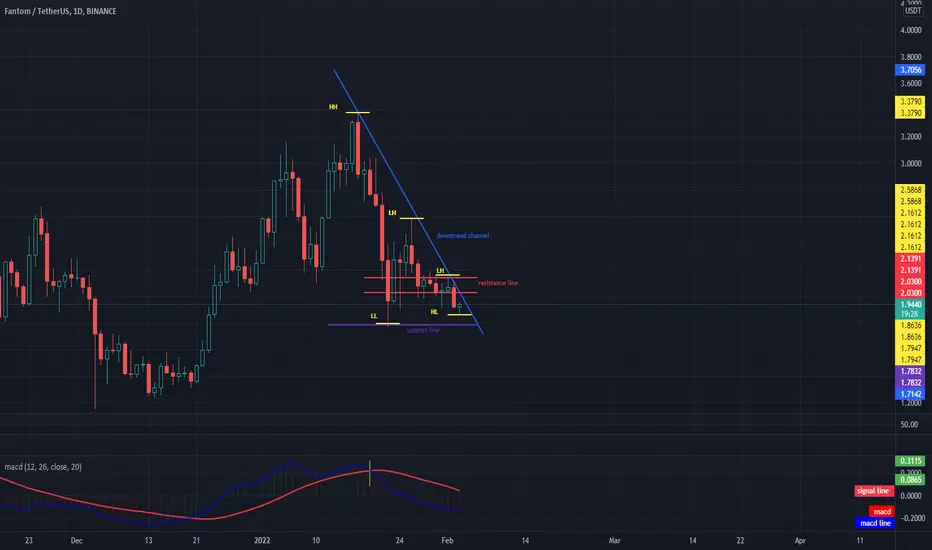
Looking at the FTM / USDT chart, you can see that we are on the uptrend line, while the pattern formed of lower and lower highs and lows indicates a downward trend. Currently, price needs to break a low at $ 2.1612 for a potential trend to reverse. The current support is at $ 1.7832 and the first resistance is at $ 2.03.
Looking at the FTM / USDT chart, you can see that we are on the uptrend line, while the pattern formed of lower and lower highs and lows indicates a downward trend. Currently, price needs to break a low at $ 2.1612 for a potential trend to reverse. The current support is at $ 1.7832 and the first resistance is at $ 2.03.

Penafian
Maklumat dan penerbitan adalah tidak bertujuan, dan tidak membentuk, nasihat atau cadangan kewangan, pelaburan, dagangan atau jenis lain yang diberikan atau disahkan oleh TradingView. Baca lebih dalam Terma Penggunaan.
Penafian
Maklumat dan penerbitan adalah tidak bertujuan, dan tidak membentuk, nasihat atau cadangan kewangan, pelaburan, dagangan atau jenis lain yang diberikan atau disahkan oleh TradingView. Baca lebih dalam Terma Penggunaan.