FTX Token Chart Mapped | Resistance & Support Levels
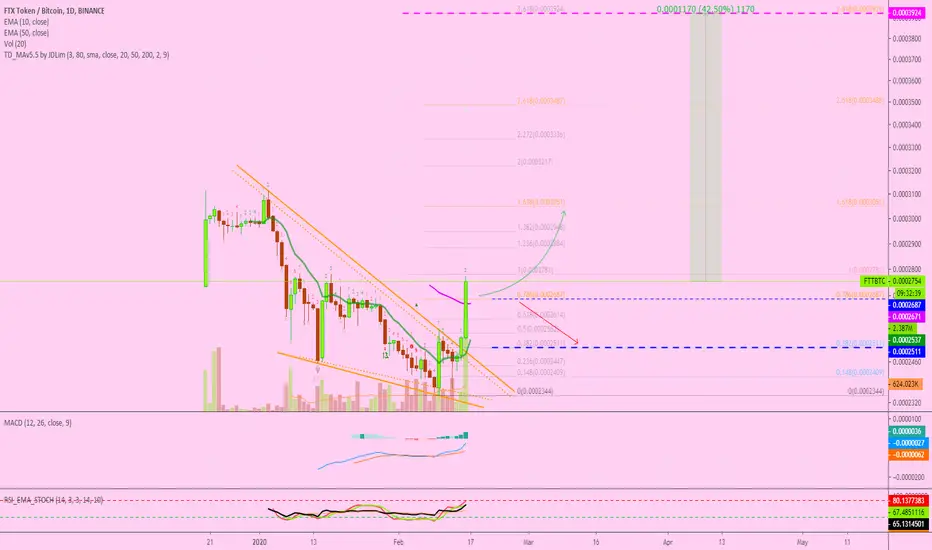
Here we have for you the FTTBTC (FTX Token) chart with Fibonacci support and resistance levels mapped.
FTX Token (FTTBTC) Chart Analysis by Alan Masters
Here we have a very strong/bullish chart.
FTX Token can easily continue to grow...
Make sure to hit LIKE if you enjoyed this post.
Thanks a lot for reading.
Namaste.
FTX Token (FTTBTC) Chart Analysis by Alan Masters
Here we have a very strong/bullish chart.
- Prices for FTTBTC are now trading above EMA50 on really high volume. With a strong daily candle close (closing at 0.00002690 or higher), FTTBTC can continue straight up.
- The RSI is bullish sitting at 65.
- The MACD is trending up and gaining momentum.
- Full bullish candle today.
- Broken falling wedge.
- Bullish Cryptocurrency Market.
FTX Token can easily continue to grow...
Make sure to hit LIKE if you enjoyed this post.
Thanks a lot for reading.
Namaste.

✅ Cryptocurrencies technical analysis & results
t.me/masteranandatrades/9279
✅ Stocks technical analysis
t.me/anandastocks
✅ Enjoyed the content? Join my PREMIUM channels for more... t.me/lamatrades/4 (since 2017)
t.me/masteranandatrades/9279
✅ Stocks technical analysis
t.me/anandastocks
✅ Enjoyed the content? Join my PREMIUM channels for more... t.me/lamatrades/4 (since 2017)
Penerbitan berkaitan
Penafian
Maklumat dan penerbitan adalah tidak bertujuan, dan tidak membentuk, nasihat atau cadangan kewangan, pelaburan, dagangan atau jenis lain yang diberikan atau disahkan oleh TradingView. Baca lebih dalam Terma Penggunaan.
✅ Cryptocurrencies technical analysis & results
t.me/masteranandatrades/9279
✅ Stocks technical analysis
t.me/anandastocks
✅ Enjoyed the content? Join my PREMIUM channels for more... t.me/lamatrades/4 (since 2017)
t.me/masteranandatrades/9279
✅ Stocks technical analysis
t.me/anandastocks
✅ Enjoyed the content? Join my PREMIUM channels for more... t.me/lamatrades/4 (since 2017)
Penerbitan berkaitan
Penafian
Maklumat dan penerbitan adalah tidak bertujuan, dan tidak membentuk, nasihat atau cadangan kewangan, pelaburan, dagangan atau jenis lain yang diberikan atau disahkan oleh TradingView. Baca lebih dalam Terma Penggunaan.