
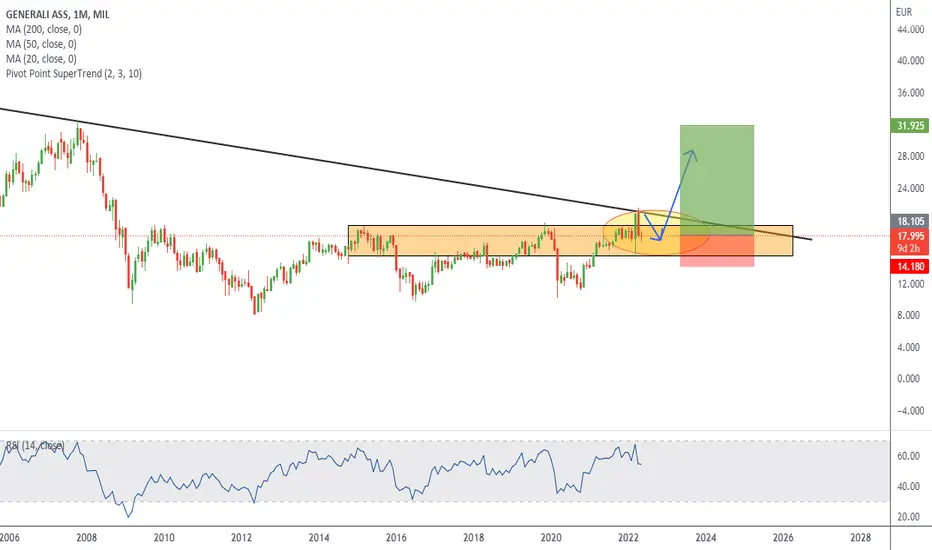
For having a better understading of what is happening on this stock about my last idea, on the Montly chart we see a clear break of structure and a retest of it after testing an important trendline(formed in Oct 07).The price has been bouncing over the last 12 years and now finally we see a strong candle formed in March this year breaking all structure and showing us bullish pressure. We can expect more bullish continuation the next months if price manage to break this trendline. Important monitoring price action in lower timeframes.

Penafian
Maklumat dan penerbitan adalah tidak bertujuan, dan tidak membentuk, nasihat atau cadangan kewangan, pelaburan, dagangan atau jenis lain yang diberikan atau disahkan oleh TradingView. Baca lebih dalam Terma Penggunaan.
Penafian
Maklumat dan penerbitan adalah tidak bertujuan, dan tidak membentuk, nasihat atau cadangan kewangan, pelaburan, dagangan atau jenis lain yang diberikan atau disahkan oleh TradingView. Baca lebih dalam Terma Penggunaan.