

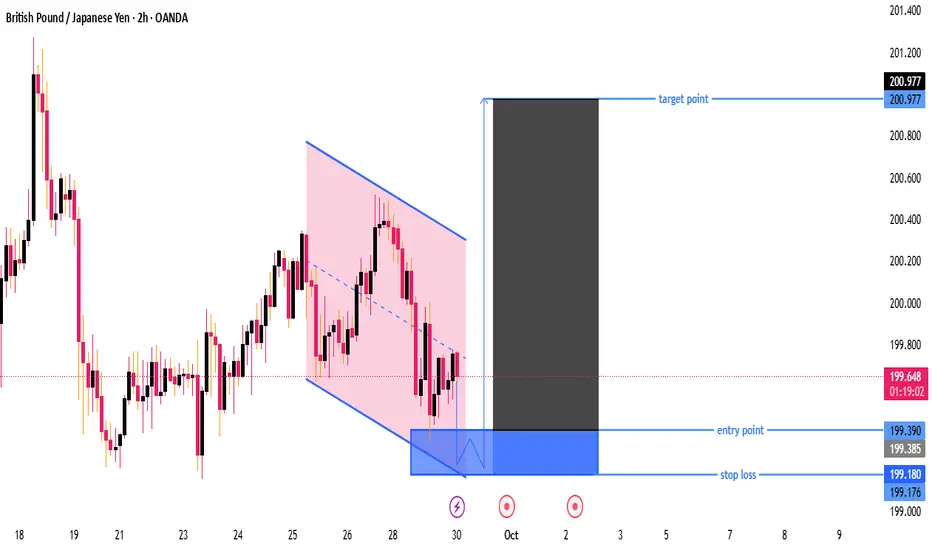
1. Chart Pattern
Price is moving inside a descending channel (highlighted in pink).
Currently, price is near the lower boundary of the channel, suggesting possible support.
2. Entry, Stop Loss & Target
Entry Point: Around 199.390
This is placed slightly above the lower support of the channel, anticipating a bounce.
Stop Loss: Around 199.180
This is just below the support zone, keeping risk tight.
If price drops below this, it means the bullish idea is invalidated.
Target Point: Around 200.977
This is close to the upper range of the recent price action, giving a good risk-to-reward ratio.
3. Trade Idea
This setup is a buy (long) position plan:
Reasoning: Buying near support of the descending channel, expecting price to break out upwards.
Risk-to-Reward: Looks favorable (roughly 1:6), which is a strong risk management setup.
4. Key Levels to Watch
199.390 (Entry) → If price sustains above this, bulls are in control.
199.180 (Stop) → If price breaks below, expect further downside.
200.977 (Target) → This is the take-profit area, near prior resistance.
---
5. Confirmation Needed
Wait for a bullish candle confirmation at the entry zone (e.g., pin bar, engulfing candle) to reduce risk of false breakout.
Keep an eye on overall trend — if higher timeframes show strong downtrend, be cautious of reversals.
✅ Summary:
This chart suggests a buy setup from support zone with tight stop-loss and a large upside target. It’s a high risk-to-reward trade but requires confirmation before entering to avoid getting caught in a further drop.
Price is moving inside a descending channel (highlighted in pink).
Currently, price is near the lower boundary of the channel, suggesting possible support.
2. Entry, Stop Loss & Target
Entry Point: Around 199.390
This is placed slightly above the lower support of the channel, anticipating a bounce.
Stop Loss: Around 199.180
This is just below the support zone, keeping risk tight.
If price drops below this, it means the bullish idea is invalidated.
Target Point: Around 200.977
This is close to the upper range of the recent price action, giving a good risk-to-reward ratio.
3. Trade Idea
This setup is a buy (long) position plan:
Reasoning: Buying near support of the descending channel, expecting price to break out upwards.
Risk-to-Reward: Looks favorable (roughly 1:6), which is a strong risk management setup.
4. Key Levels to Watch
199.390 (Entry) → If price sustains above this, bulls are in control.
199.180 (Stop) → If price breaks below, expect further downside.
200.977 (Target) → This is the take-profit area, near prior resistance.
---
5. Confirmation Needed
Wait for a bullish candle confirmation at the entry zone (e.g., pin bar, engulfing candle) to reduce risk of false breakout.
Keep an eye on overall trend — if higher timeframes show strong downtrend, be cautious of reversals.
✅ Summary:
This chart suggests a buy setup from support zone with tight stop-loss and a large upside target. It’s a high risk-to-reward trade but requires confirmation before entering to avoid getting caught in a further drop.

join my telegram channel t.me/AI_algo_gold_master t.me/AI_algo_gold_master
Penafian
Maklumat dan penerbitan adalah tidak bertujuan, dan tidak membentuk, nasihat atau cadangan kewangan, pelaburan, dagangan atau jenis lain yang diberikan atau disahkan oleh TradingView. Baca lebih dalam Terma Penggunaan.
join my telegram channel t.me/AI_algo_gold_master t.me/AI_algo_gold_master
Penafian
Maklumat dan penerbitan adalah tidak bertujuan, dan tidak membentuk, nasihat atau cadangan kewangan, pelaburan, dagangan atau jenis lain yang diberikan atau disahkan oleh TradingView. Baca lebih dalam Terma Penggunaan.