

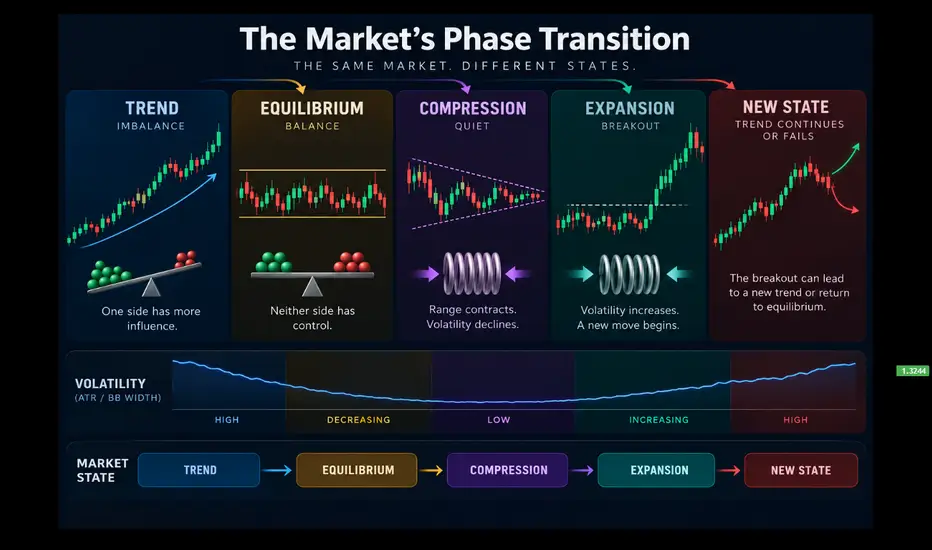
In physics, matter can exist in different states. Water can be ice, liquid, or vapor, and each state behaves differently even though it is made from the same basic substance. A change in temperature or pressure can cause one state to transform into another. Financial markets can behave in a similar way. The same market can spend weeks trending, move into a range, become increasingly quiet, and then suddenly expand into a powerful move. The market has not changed completely, but its state has changed.
A Trend Is a State of Imbalance
A trend exists when one side of the market consistently has more influence than the other. In an uptrend, buyers are willing to accept higher prices, while in a downtrend, sellers continue accepting lower prices. This creates directional persistence and produces familiar structures such as higher highs and higher lows or lower highs and lower lows. But a trend eventually loses some of this imbalance. Price may still move in the same direction, but the movement becomes less efficient. Pullbacks become deeper, momentum weakens, and the market begins spending more time around certain prices. This can be the first sign that the market is preparing to enter a different state.
Trend → Equilibrium
After a sustained directional move, the market can enter a period where neither buyers nor sellers have enough strength to maintain control. Price starts moving sideways and repeatedly returns toward the same area. Traders usually call this consolidation, but another way to view it is equilibrium. The market is searching for a price where enough participants are willing to transact. Existing positions are closed, new positions are built, and expectations begin to change. What looks like boring sideways movement can actually be a period in which the market is reorganizing itself.
Equilibrium → Compression
Sometimes equilibrium becomes even tighter. The trading range contracts, candles become smaller, and volatility starts declining. Price may repeatedly move between two nearby areas without making meaningful progress in either direction. This is where the physics analogy becomes interesting. Think about a spring being compressed. It may appear quiet from the outside, but its internal condition has changed. A compressed market behaves similarly. Compression does not tell us whether the next major move will be higher or lower, but it tells us that the current quiet state may eventually give way to a larger movement.
Compression → Expansion
Eventually, the balance can break. Price leaves the compressed range, volatility increases, candles become larger, and momentum begins to accelerate. The market suddenly looks completely different from the market that existed only a few sessions earlier. This is the phase transition. However, the transition is not necessarily the breakout candle itself. The breakout is simply the point where the change becomes obvious. The conditions for that move may have been developing much earlier through declining volatility, narrowing ranges, repeated tests, and failed attempts to escape the established area.
Why Traders Often Enter After the Transition
This is where the concept becomes useful for trading. Imagine a market that has been trending upward for several weeks. A trader uses a trend-following strategy and continues buying pullbacks. Eventually, the trend weakens and the market enters a range. The trader continues using the same strategy and starts experiencing failed breakouts. Then, after several attempts, the market finally breaks out and begins another strong move. The trader waits for confirmation and enters. The direction may have been correct, but the market state was recognized too late. The trader was still treating a range like a trend and only changed their approach after the new trend had already become obvious.
What Changes Before the Phase Transition?
There is no single indicator that can tell us exactly when a market will change state. Instead, we can look for changes in behavior. Volatility is one of the most useful clues. ATR, historical volatility, and Bollinger Band width can show whether the market's normal movement is expanding or contracting. Range structure is another clue. A market that once produced large directional candles may begin producing smaller and more overlapping candles. Repeated failed breakouts can also show that the market is testing its boundaries without yet finding enough participation to establish a new direction.
Failed Breakouts Are Information
A failed breakout is not necessarily meaningless noise. When price repeatedly attempts to leave a range and returns inside, the market is effectively testing whether participants are willing to accept prices outside the established area. If those attempts repeatedly fail, the market may still be in equilibrium. But when price eventually breaks out and remains outside the previous range, something different may be happening. The important distinction is not simply whether price crossed a level. It is whether the market accepted or rejected the new prices.
Acceptance Is More Important Than the First Breakout Candle
A candle closing above resistance can look impressive, but the real information often comes afterward. Does price immediately fall back into the previous range, or does it continue trading around the new area? Does volume support the movement? Does the old resistance become support? Does price begin building value above the previous range? These questions help distinguish a temporary price excursion from a genuine change in market behavior. A phase transition is therefore better understood through what happens after the breakout rather than through the breakout candle alone.
Different Market States Require Different Thinking
This also explains why a trading strategy can work extremely well for several months and then suddenly start producing poor results. Trend-following strategies depend on directional persistence. Mean-reversion strategies depend on equilibrium. Breakout strategies depend on expansion. A strategy does not necessarily become useless just because its performance changes. The market environment may simply no longer support the conditions that strategy needs. The important question is therefore not only, “Is my setup present?” but also, “Is the current market state suitable for this setup?
The Market Does Not Have to Follow a Perfect Cycle
The phase-transition model should not be treated as a fixed formula. Markets do not always move neatly from trend to equilibrium, then compression, then expansion. A breakout can fail. A range can continue for months. A trend can accelerate without meaningful compression. The value of the model is not in predicting a perfect sequence. It is in helping traders recognize that market behavior changes and that the same strategy should not automatically be applied to every environment.
The Most Important Move May Begin Before the Breakout
When traders look back at a large market move, they often focus on the candle that started it. But the more interesting information may have appeared much earlier. The range may have been getting smaller. Volatility may have been declining. Price may have repeatedly tested the same boundaries. Failed breakouts may have become more frequent. These changes can reveal that the market is approaching a different state before the final expansion becomes obvious.
Stop Asking Only Where Price Is Going
The usual question in trading is, “Where will price go next?” But perhaps another question is just as important: “What state is the market currently in?” A market in a strong trend should not be approached in exactly the same way as a market trapped inside a narrow range. A compressed market should not be treated like an already-expanded market. Recognizing the state can help traders understand why a setup that worked yesterday may fail today.
The Market Is Constantly Changing State
Markets are not permanently bullish, bearish, trending, or ranging. They are constantly transitioning between different conditions. Trend can become equilibrium. Equilibrium can become compression. Compression can become expansion. Expansion can develop into another trend or fail and return to equilibrium. The exact sequence cannot be known in advance, but the changes in behavior can be observed.
The breakout, therefore, may not be the beginning of the story. It may be the moment when the market's hidden transition finally becomes visible.
A Trend Is a State of Imbalance
A trend exists when one side of the market consistently has more influence than the other. In an uptrend, buyers are willing to accept higher prices, while in a downtrend, sellers continue accepting lower prices. This creates directional persistence and produces familiar structures such as higher highs and higher lows or lower highs and lower lows. But a trend eventually loses some of this imbalance. Price may still move in the same direction, but the movement becomes less efficient. Pullbacks become deeper, momentum weakens, and the market begins spending more time around certain prices. This can be the first sign that the market is preparing to enter a different state.
Trend → Equilibrium
After a sustained directional move, the market can enter a period where neither buyers nor sellers have enough strength to maintain control. Price starts moving sideways and repeatedly returns toward the same area. Traders usually call this consolidation, but another way to view it is equilibrium. The market is searching for a price where enough participants are willing to transact. Existing positions are closed, new positions are built, and expectations begin to change. What looks like boring sideways movement can actually be a period in which the market is reorganizing itself.
Equilibrium → Compression
Sometimes equilibrium becomes even tighter. The trading range contracts, candles become smaller, and volatility starts declining. Price may repeatedly move between two nearby areas without making meaningful progress in either direction. This is where the physics analogy becomes interesting. Think about a spring being compressed. It may appear quiet from the outside, but its internal condition has changed. A compressed market behaves similarly. Compression does not tell us whether the next major move will be higher or lower, but it tells us that the current quiet state may eventually give way to a larger movement.
Compression → Expansion
Eventually, the balance can break. Price leaves the compressed range, volatility increases, candles become larger, and momentum begins to accelerate. The market suddenly looks completely different from the market that existed only a few sessions earlier. This is the phase transition. However, the transition is not necessarily the breakout candle itself. The breakout is simply the point where the change becomes obvious. The conditions for that move may have been developing much earlier through declining volatility, narrowing ranges, repeated tests, and failed attempts to escape the established area.
Why Traders Often Enter After the Transition
This is where the concept becomes useful for trading. Imagine a market that has been trending upward for several weeks. A trader uses a trend-following strategy and continues buying pullbacks. Eventually, the trend weakens and the market enters a range. The trader continues using the same strategy and starts experiencing failed breakouts. Then, after several attempts, the market finally breaks out and begins another strong move. The trader waits for confirmation and enters. The direction may have been correct, but the market state was recognized too late. The trader was still treating a range like a trend and only changed their approach after the new trend had already become obvious.
What Changes Before the Phase Transition?
There is no single indicator that can tell us exactly when a market will change state. Instead, we can look for changes in behavior. Volatility is one of the most useful clues. ATR, historical volatility, and Bollinger Band width can show whether the market's normal movement is expanding or contracting. Range structure is another clue. A market that once produced large directional candles may begin producing smaller and more overlapping candles. Repeated failed breakouts can also show that the market is testing its boundaries without yet finding enough participation to establish a new direction.
Failed Breakouts Are Information
A failed breakout is not necessarily meaningless noise. When price repeatedly attempts to leave a range and returns inside, the market is effectively testing whether participants are willing to accept prices outside the established area. If those attempts repeatedly fail, the market may still be in equilibrium. But when price eventually breaks out and remains outside the previous range, something different may be happening. The important distinction is not simply whether price crossed a level. It is whether the market accepted or rejected the new prices.
Acceptance Is More Important Than the First Breakout Candle
A candle closing above resistance can look impressive, but the real information often comes afterward. Does price immediately fall back into the previous range, or does it continue trading around the new area? Does volume support the movement? Does the old resistance become support? Does price begin building value above the previous range? These questions help distinguish a temporary price excursion from a genuine change in market behavior. A phase transition is therefore better understood through what happens after the breakout rather than through the breakout candle alone.
Different Market States Require Different Thinking
This also explains why a trading strategy can work extremely well for several months and then suddenly start producing poor results. Trend-following strategies depend on directional persistence. Mean-reversion strategies depend on equilibrium. Breakout strategies depend on expansion. A strategy does not necessarily become useless just because its performance changes. The market environment may simply no longer support the conditions that strategy needs. The important question is therefore not only, “Is my setup present?” but also, “Is the current market state suitable for this setup?
The Market Does Not Have to Follow a Perfect Cycle
The phase-transition model should not be treated as a fixed formula. Markets do not always move neatly from trend to equilibrium, then compression, then expansion. A breakout can fail. A range can continue for months. A trend can accelerate without meaningful compression. The value of the model is not in predicting a perfect sequence. It is in helping traders recognize that market behavior changes and that the same strategy should not automatically be applied to every environment.
The Most Important Move May Begin Before the Breakout
When traders look back at a large market move, they often focus on the candle that started it. But the more interesting information may have appeared much earlier. The range may have been getting smaller. Volatility may have been declining. Price may have repeatedly tested the same boundaries. Failed breakouts may have become more frequent. These changes can reveal that the market is approaching a different state before the final expansion becomes obvious.
Stop Asking Only Where Price Is Going
The usual question in trading is, “Where will price go next?” But perhaps another question is just as important: “What state is the market currently in?” A market in a strong trend should not be approached in exactly the same way as a market trapped inside a narrow range. A compressed market should not be treated like an already-expanded market. Recognizing the state can help traders understand why a setup that worked yesterday may fail today.
The Market Is Constantly Changing State
Markets are not permanently bullish, bearish, trending, or ranging. They are constantly transitioning between different conditions. Trend can become equilibrium. Equilibrium can become compression. Compression can become expansion. Expansion can develop into another trend or fail and return to equilibrium. The exact sequence cannot be known in advance, but the changes in behavior can be observed.
The breakout, therefore, may not be the beginning of the story. It may be the moment when the market's hidden transition finally becomes visible.
Markets do not simply move from one price to another. They move through different states. The real skill may not be predicting the next candle, but recognizing when the state of the market is beginning to change.

Penerbitan berkaitan
Penafian
Maklumat dan penerbitan adalah tidak bertujuan, dan tidak membentuk, nasihat atau cadangan kewangan, pelaburan, dagangan atau jenis lain yang diberikan atau disahkan oleh TradingView. Baca lebih dalam Terma Penggunaan.
Penerbitan berkaitan
Penafian
Maklumat dan penerbitan adalah tidak bertujuan, dan tidak membentuk, nasihat atau cadangan kewangan, pelaburan, dagangan atau jenis lain yang diberikan atau disahkan oleh TradingView. Baca lebih dalam Terma Penggunaan.