GBP/USD Bounces Back
GBP/USD Bounces Back
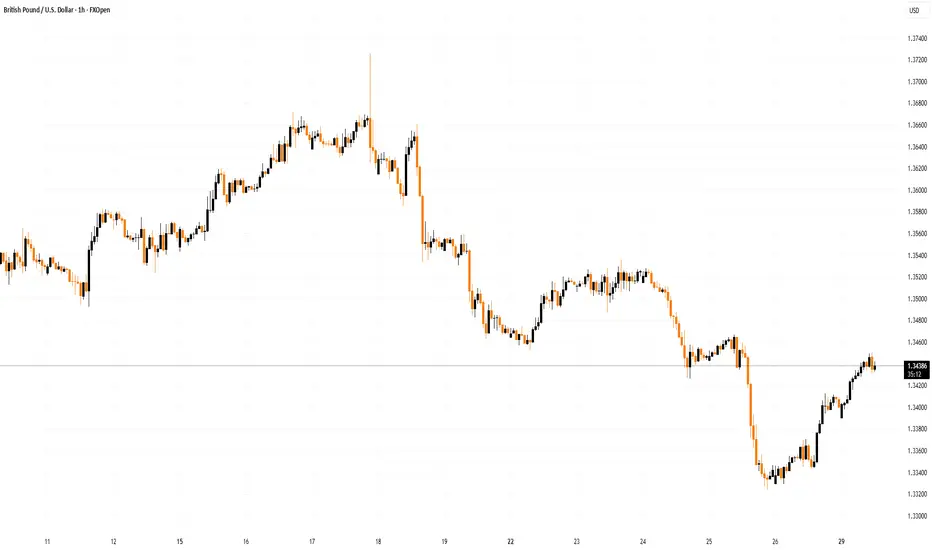
GBP/USD is attempting a recovery wave from 1.3325.
Important Takeaways for GBP/USD Analysis Today
- The British Pound started a recovery wave above 1.3370 and 1.3400.
- There was a break above a key bearish trend line with resistance near 1.3390 on the hourly chart of GBP/USD.
GBP/USD Technical Analysis

On the hourly chart of GBP/USD, the pair started a fresh decline from 1.3530 after a decent increase. The British Pound traded below 1.3450 to again move into a short-term bearish zone against the US Dollar.
The pair even traded below 1.3400 and the 50-hour simple moving average. Finally, the bulls appeared near 1.3325. A low was formed near 1.3323 and the pair is now attempting a short-term recovery wave.
There was a fresh upside above 1.3370 and the 23.6% Fib retracement level of the downward move from the 1.3528 swing high to the 1.3323 low. More importantly, there was a break above a key bearish trend line with resistance near 1.3390.
The pair is now showing positive signs above 1.3420. Immediate resistance on the upside is near the 61% Fib retracement at 1.3450. The first major hurdle for the bulls on the GBP/USD chart is 1.3480.
A close above 1.3480 might spark a decent increase. The next stop for the bulls might be 1.3530. Any more gains could lead the pair toward 1.3620 in the near term. Initial support sits near the 50-hour simple moving average at 1.3390.
The next key area of interest might be 1.3370, below which there is a risk of another sharp decline. In the stated case, the pair could drop toward 1.3325.
This article represents the opinion of the Companies operating under the FXOpen brand only. It is not to be construed as an offer, solicitation, or recommendation with respect to products and services provided by the Companies operating under the FXOpen brand, nor is it to be considered financial advice.
GBP/USD is attempting a recovery wave from 1.3325.
Important Takeaways for GBP/USD Analysis Today
- The British Pound started a recovery wave above 1.3370 and 1.3400.
- There was a break above a key bearish trend line with resistance near 1.3390 on the hourly chart of GBP/USD.
GBP/USD Technical Analysis
On the hourly chart of GBP/USD, the pair started a fresh decline from 1.3530 after a decent increase. The British Pound traded below 1.3450 to again move into a short-term bearish zone against the US Dollar.
The pair even traded below 1.3400 and the 50-hour simple moving average. Finally, the bulls appeared near 1.3325. A low was formed near 1.3323 and the pair is now attempting a short-term recovery wave.
There was a fresh upside above 1.3370 and the 23.6% Fib retracement level of the downward move from the 1.3528 swing high to the 1.3323 low. More importantly, there was a break above a key bearish trend line with resistance near 1.3390.
The pair is now showing positive signs above 1.3420. Immediate resistance on the upside is near the 61% Fib retracement at 1.3450. The first major hurdle for the bulls on the GBP/USD chart is 1.3480.
A close above 1.3480 might spark a decent increase. The next stop for the bulls might be 1.3530. Any more gains could lead the pair toward 1.3620 in the near term. Initial support sits near the 50-hour simple moving average at 1.3390.
The next key area of interest might be 1.3370, below which there is a risk of another sharp decline. In the stated case, the pair could drop toward 1.3325.
This article represents the opinion of the Companies operating under the FXOpen brand only. It is not to be construed as an offer, solicitation, or recommendation with respect to products and services provided by the Companies operating under the FXOpen brand, nor is it to be considered financial advice.

Penafian
Maklumat dan penerbitan adalah tidak bertujuan, dan tidak membentuk, nasihat atau cadangan kewangan, pelaburan, dagangan atau jenis lain yang diberikan atau disahkan oleh TradingView. Baca lebih dalam Terma Penggunaan.
Penafian
Maklumat dan penerbitan adalah tidak bertujuan, dan tidak membentuk, nasihat atau cadangan kewangan, pelaburan, dagangan atau jenis lain yang diberikan atau disahkan oleh TradingView. Baca lebih dalam Terma Penggunaan.