

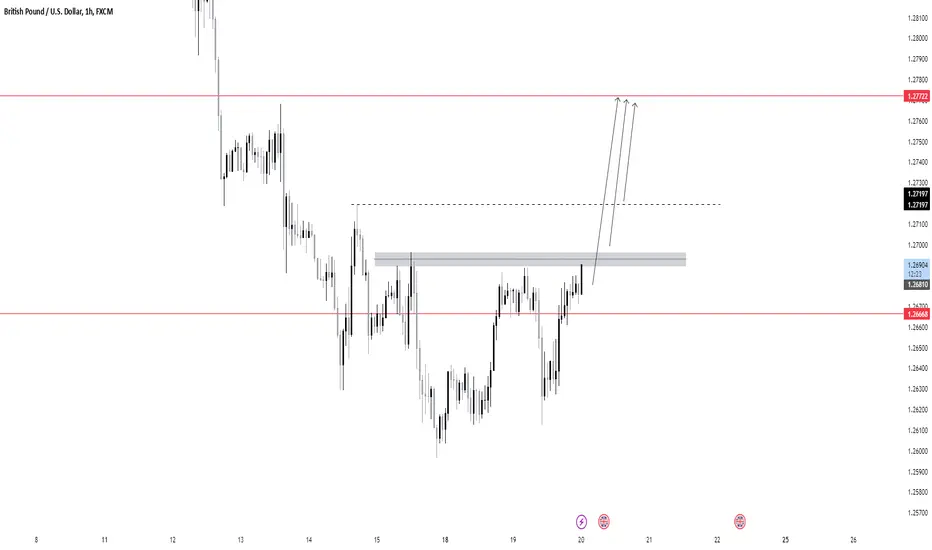
This chart displays the GBP/USD pair on the 1-hour timeframe currently leaning bullish, as the price has shown strength approaching the resistance.
The price is currently testing a key resistance zone around the 1.2689-1.2700 level, with potential bullish momentum indicated by the recent rally.
If the price breaks above the resistance zone and closes beyond 1.2700, it could indicate a continuation toward the next resistance level at 1.2777
The price is currently testing a key resistance zone around the 1.2689-1.2700 level, with potential bullish momentum indicated by the recent rally.
If the price breaks above the resistance zone and closes beyond 1.2700, it could indicate a continuation toward the next resistance level at 1.2777

iSmashProfit
Penerbitan berkaitan
Penafian
Maklumat dan penerbitan adalah tidak bertujuan, dan tidak membentuk, nasihat atau cadangan kewangan, pelaburan, dagangan atau jenis lain yang diberikan atau disahkan oleh TradingView. Baca lebih dalam Terma Penggunaan.
iSmashProfit
Penerbitan berkaitan
Penafian
Maklumat dan penerbitan adalah tidak bertujuan, dan tidak membentuk, nasihat atau cadangan kewangan, pelaburan, dagangan atau jenis lain yang diberikan atau disahkan oleh TradingView. Baca lebih dalam Terma Penggunaan.