Singkat
Ger30 Short
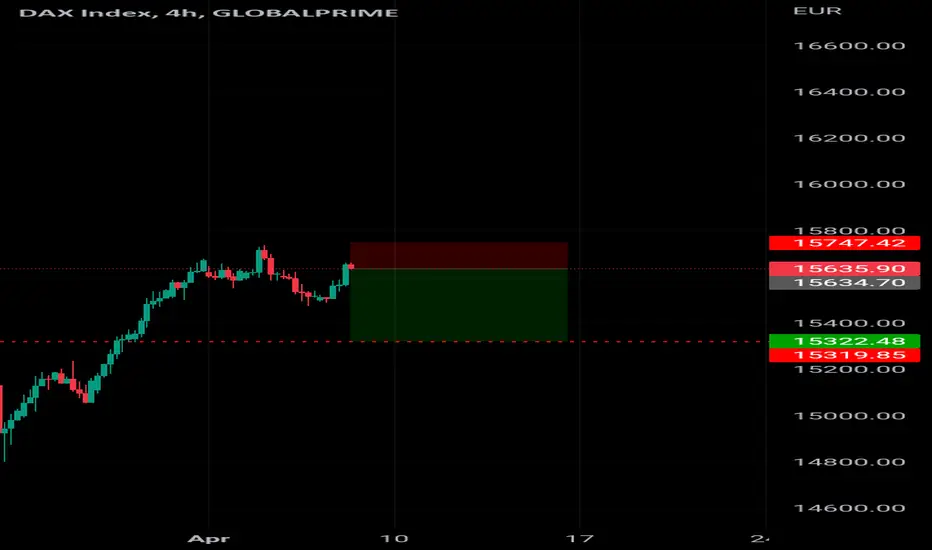
Ger30 Short potential
Short it now
The GER30 daily chart is trading in its bullish channel between its upper blue and red bands. It RSI is trading above 50 (green rectangle). The longer it maintains on the bullish side of 50 the greater the probability of higher prices ahead.
The hourly chart shows a strong start to today's trade. The trend following EMAs and the momentum-based stochastic have turned up (black ellipses). If the stochastic makes its way to the 80+ levels (blue arrow) and holds it will denote a strong underlying bullish momentum is present.

Penafian
Maklumat dan penerbitan adalah tidak bertujuan, dan tidak membentuk, nasihat atau cadangan kewangan, pelaburan, dagangan atau jenis lain yang diberikan atau disahkan oleh TradingView. Baca lebih dalam Terma Penggunaan.
Penafian
Maklumat dan penerbitan adalah tidak bertujuan, dan tidak membentuk, nasihat atau cadangan kewangan, pelaburan, dagangan atau jenis lain yang diberikan atau disahkan oleh TradingView. Baca lebih dalam Terma Penggunaan.