
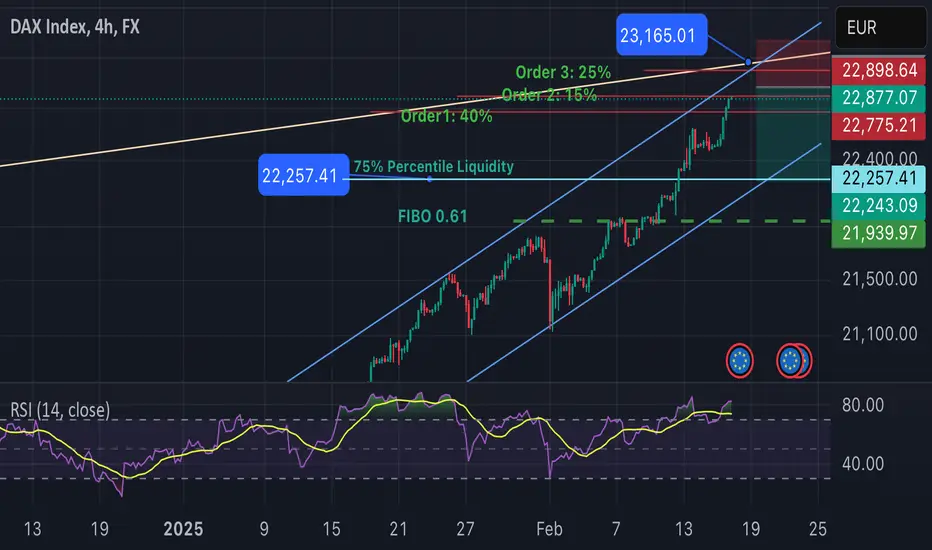
. Trend Lines and Moving Averages:
• Moving Averages (MA): Check the 50-day and 200-day moving averages. DAX is trading above these averages and the 50-day is above the 200-day, that generally indicates an upward trend. A crossover (where the 50-day falls below the 200-day) might suggest a shift to a bearish trend. Stay tuned!!
• Trend Lines: Draw trend lines connecting recent highs & lows. An upward-sloping trend line suggests bullish momentum, Which, in reality triggers an alarm for shortterm buyers to start selling and waiting for a pull back to buy cheaper by waiting downward-sloping bearish pressure.
2. Relative Strength Index (RSI):
• An RSI above 70 typically indicates that the asset might be overbought, suggesting a possible pullback or consolidation.

Penafian
Maklumat dan penerbitan adalah tidak bertujuan, dan tidak membentuk, nasihat atau cadangan kewangan, pelaburan, dagangan atau jenis lain yang diberikan atau disahkan oleh TradingView. Baca lebih dalam Terma Penggunaan.
Penafian
Maklumat dan penerbitan adalah tidak bertujuan, dan tidak membentuk, nasihat atau cadangan kewangan, pelaburan, dagangan atau jenis lain yang diberikan atau disahkan oleh TradingView. Baca lebih dalam Terma Penggunaan.