$GLCH projection based on the LOG chart
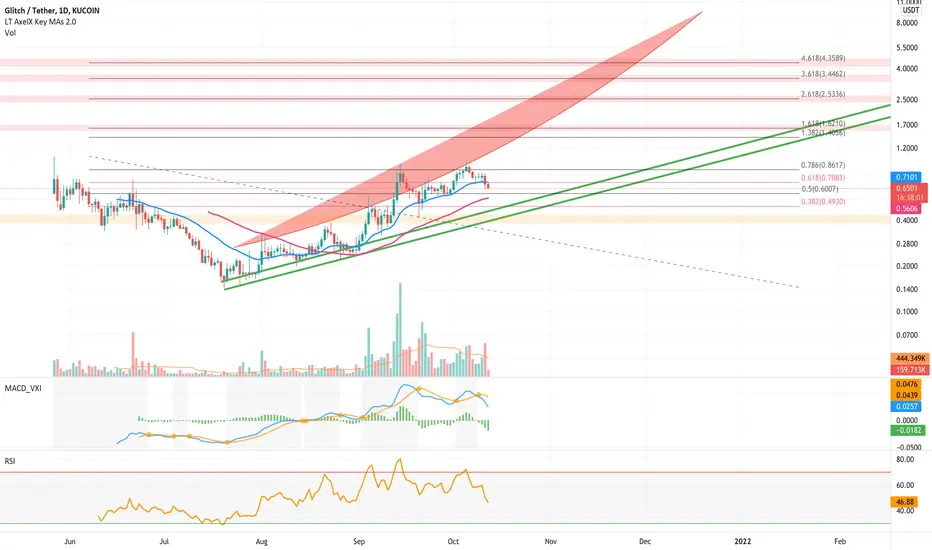
My previous model on GGCH is broken, this model only looked at linear data. Since most of the moves in crypto are exponential most of the times. It could be better to take the LOG chart in consideration...
In this chart potential upside and downside is greater.
The support band of the LOG chart shows a potential bottom between $0.47 - $0.40.
In this chart potential upside and downside is greater.
The support band of the LOG chart shows a potential bottom between $0.47 - $0.40.

Penafian
Maklumat dan penerbitan adalah tidak bertujuan, dan tidak membentuk, nasihat atau cadangan kewangan, pelaburan, dagangan atau jenis lain yang diberikan atau disahkan oleh TradingView. Baca lebih dalam Terma Penggunaan.
Penafian
Maklumat dan penerbitan adalah tidak bertujuan, dan tidak membentuk, nasihat atau cadangan kewangan, pelaburan, dagangan atau jenis lain yang diberikan atau disahkan oleh TradingView. Baca lebih dalam Terma Penggunaan.