
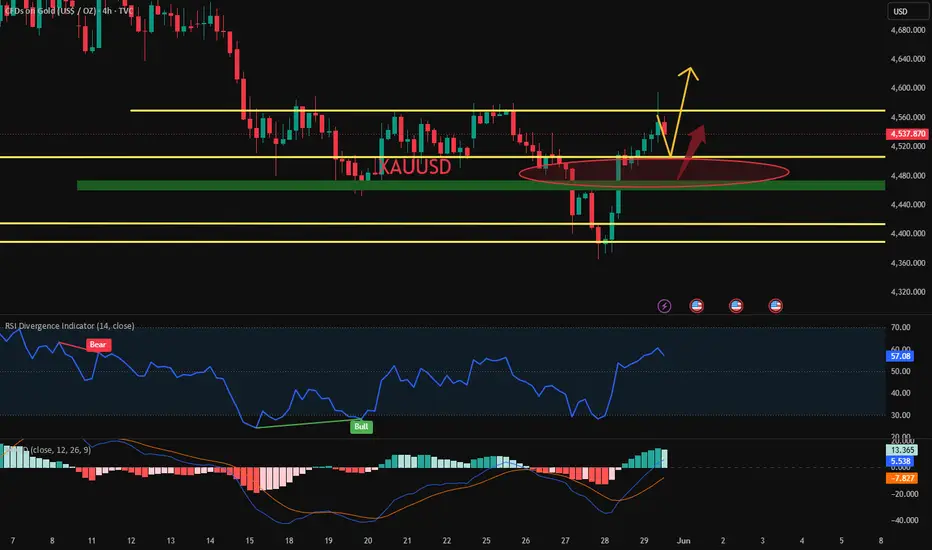
4-hour chart: The bottoming pattern has been confirmed, and a reversal is underway. The Moving Averages (MA) have formed a "Golden Cross," and the price is trading above the support level. The MACD indicator has formed a bullish golden cross below the zero line, indicating that upward momentum is accumulating. However, gold prices encountered slight selling pressure around $4,594, causing the upward momentum to slow. Monday's market movement is expected to be a corrective pattern of fluctuating upward movement. 1-hour chart: After a surge, the price has entered a consolidation phase; short-term moving averages are intertwined – the bulls and bears are in a state of evenly matched struggle. The key support level is located in the 4510–4500 range (this is a key area for defending against pullbacks). The immediate resistance level is located in the 4595–4595–4600 range; if this resistance is broken effectively, the upside potential will open up to $4650. Monday's Trading Strategy:
Main Tactics: Sell on rallies, buy on dips. Key resistance level: 4565–4575
Key support level: 4480
– 4480–4450 Scalp entry points:
Sell on a rebound: Enter in the 4590-4600 range; if the rebound continues, add to the short position in the 4640-4640-4650 range.
Buy on pullback: Enter in the 4500-4510 range; if the pullback continues, add to your long position in the 4480-4480-4470 range.

Penafian
Maklumat dan penerbitan adalah tidak bertujuan, dan tidak membentuk, nasihat atau cadangan kewangan, pelaburan, dagangan atau jenis lain yang diberikan atau disahkan oleh TradingView. Baca lebih dalam Terma Penggunaan.
Penafian
Maklumat dan penerbitan adalah tidak bertujuan, dan tidak membentuk, nasihat atau cadangan kewangan, pelaburan, dagangan atau jenis lain yang diberikan atau disahkan oleh TradingView. Baca lebih dalam Terma Penggunaan.