
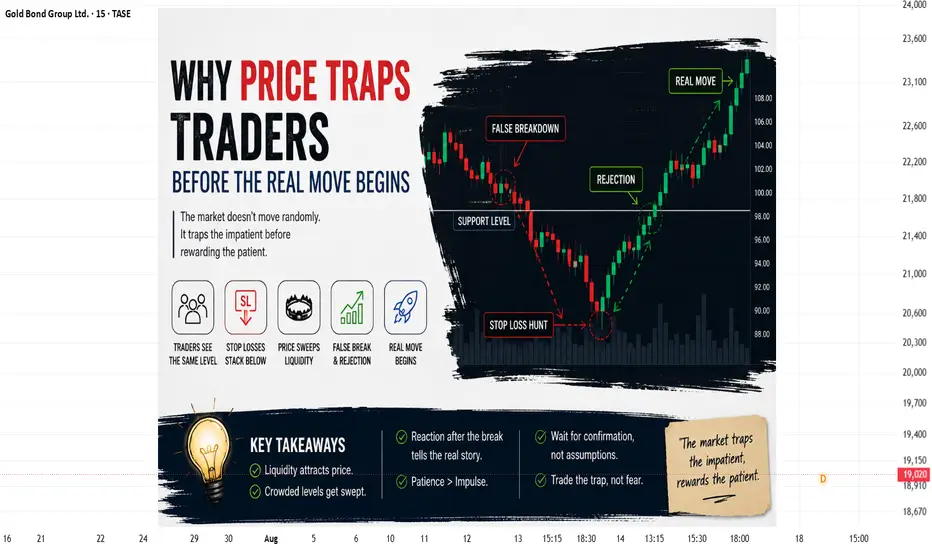
One of the most frustrating things in trading is being right about the direction — and still losing money.
You identify a support level. Price starts moving in your expected direction. You enter the trade, feeling confident. Then suddenly, the market reverses, hits your stop-loss, and only afterward makes the move you originally expected.
It feels like the market was targeting your trade.
But most of the time, there is something more interesting happening.
The Market Often Moves Where Traders Expect It to Move
Price does not move simply because a chart pattern looks perfect.
Behind every move are orders — buyers, sellers, stop-losses, breakout entries, profit-taking orders, and traders waiting for confirmation.
When many traders see the same level, they often place orders around the same area.
That creates liquidity.
And liquidity can become the fuel for the next move.
The Classic Stop-Loss Trap
Imagine a stock is trading near a well-known support level at ₹500.
Traders notice the level and think:
“If ₹500 holds, price should go higher.”
So they buy around ₹500 and place their stop-loss below the support, perhaps around ₹495.
Now imagine price briefly falls to ₹493.
The support appears to have failed.
Some traders exit manually. Others are stopped out automatically. Breakout traders may even start selling because they believe the support has broken.
But then something changes.
Price quickly climbs back above ₹500 and starts moving toward ₹520 or ₹530.
The traders who were stopped out watch the move from the sidelines.
The important lesson is not that every stop-loss is “hunted.”
The lesson is that crowded levels can create predictable pockets of liquidity.
A Fake Breakout Can Reveal Market Intent
This is why false breakouts can be so important.
A breakout above resistance attracts buyers.
A breakdown below support attracts sellers.
But when price quickly rejects the breakout and returns inside the previous range, the market may be showing that the move lacked genuine follow-through.
For example:
Resistance → Breakout → Buyers enter → Price rejects → Price falls back inside the range
That rejection can tell you more than the initial breakout itself.
Instead of asking only:
“Did price break the level?”
Try asking:
“What happened after the break?”
That second question often gives much better information.
Why Traders Get Trapped
Traders usually get trapped for one simple reason:
They react to the first move instead of studying the entire sequence.
A strong candle can create excitement.
A breakdown can create fear.
A breakout can create FOMO.
But professional trading is rarely about reacting to one candle.
It is about understanding context.
Where is the market trading?
Where is liquidity likely sitting?
Is the move supported by volume?
Did price actually hold beyond the level?
Did the market reclaim the level after breaking it?
These questions can help separate a genuine move from a temporary trap.
The Real Move Often Comes After the Trap
One of the most interesting market behaviors is:
Trap → Rejection → Reclaim → Expansion
Price first moves against the obvious expectation.
Traders are forced out.
Then price reclaims the important level.
Only afterward does the larger directional move begin.
This doesn't mean every false breakout will become a major reversal. Markets can continue breaking down or breaking out.
The point is to avoid treating every level break as confirmation.
Sometimes the reaction after the break is the real information.
How to Trade the Situation
Instead of entering immediately at every support or resistance level, consider waiting for evidence.
Look for:
This can help reduce the temptation to chase the first move.
The Biggest Mistake
The biggest mistake is thinking:
“The market took my stop, so it must have been manipulated.”
Sometimes your stop was simply placed in an obvious location and the market naturally traded through that area.
A stop-loss is not supposed to predict the market.
It is supposed to define the amount of risk you are willing to accept.
The goal is not to place a stop where the market can never reach it.
The goal is to build a trade where the entry, invalidation level, position size, and potential reward all make sense.
Final Thought
Price traps are not magic signals.
They are a reminder that the first move is not always the real move.
The market can create fear before an uptrend, excitement before a reversal, and confidence just before invalidation.
So instead of asking:
“Where will price go next?”
Try asking:
“Who is trapped here, where is the liquidity, and what is price doing after the trap?”
That shift in perspective can completely change the way you read a chart.
Sometimes, the move that looks like a breakout is actually the setup.
And the real move begins only after the market has finished trapping the impatient traders.
You identify a support level. Price starts moving in your expected direction. You enter the trade, feeling confident. Then suddenly, the market reverses, hits your stop-loss, and only afterward makes the move you originally expected.
It feels like the market was targeting your trade.
But most of the time, there is something more interesting happening.
The Market Often Moves Where Traders Expect It to Move
Price does not move simply because a chart pattern looks perfect.
Behind every move are orders — buyers, sellers, stop-losses, breakout entries, profit-taking orders, and traders waiting for confirmation.
When many traders see the same level, they often place orders around the same area.
That creates liquidity.
And liquidity can become the fuel for the next move.
The Classic Stop-Loss Trap
Imagine a stock is trading near a well-known support level at ₹500.
Traders notice the level and think:
“If ₹500 holds, price should go higher.”
So they buy around ₹500 and place their stop-loss below the support, perhaps around ₹495.
Now imagine price briefly falls to ₹493.
The support appears to have failed.
Some traders exit manually. Others are stopped out automatically. Breakout traders may even start selling because they believe the support has broken.
But then something changes.
Price quickly climbs back above ₹500 and starts moving toward ₹520 or ₹530.
The traders who were stopped out watch the move from the sidelines.
The important lesson is not that every stop-loss is “hunted.”
The lesson is that crowded levels can create predictable pockets of liquidity.
A Fake Breakout Can Reveal Market Intent
This is why false breakouts can be so important.
A breakout above resistance attracts buyers.
A breakdown below support attracts sellers.
But when price quickly rejects the breakout and returns inside the previous range, the market may be showing that the move lacked genuine follow-through.
For example:
Resistance → Breakout → Buyers enter → Price rejects → Price falls back inside the range
That rejection can tell you more than the initial breakout itself.
Instead of asking only:
“Did price break the level?”
Try asking:
“What happened after the break?”
That second question often gives much better information.
Why Traders Get Trapped
Traders usually get trapped for one simple reason:
They react to the first move instead of studying the entire sequence.
A strong candle can create excitement.
A breakdown can create fear.
A breakout can create FOMO.
But professional trading is rarely about reacting to one candle.
It is about understanding context.
Where is the market trading?
Where is liquidity likely sitting?
Is the move supported by volume?
Did price actually hold beyond the level?
Did the market reclaim the level after breaking it?
These questions can help separate a genuine move from a temporary trap.
The Real Move Often Comes After the Trap
One of the most interesting market behaviors is:
Trap → Rejection → Reclaim → Expansion
Price first moves against the obvious expectation.
Traders are forced out.
Then price reclaims the important level.
Only afterward does the larger directional move begin.
This doesn't mean every false breakout will become a major reversal. Markets can continue breaking down or breaking out.
The point is to avoid treating every level break as confirmation.
Sometimes the reaction after the break is the real information.
How to Trade the Situation
Instead of entering immediately at every support or resistance level, consider waiting for evidence.
Look for:
- A liquidity sweep beyond an obvious level
- Strong rejection from the area
- Price returning inside the previous range
- A reclaim of the broken level
- Volume confirmation
- A change in market structure
- Follow-through after the reclaim
This can help reduce the temptation to chase the first move.
The Biggest Mistake
The biggest mistake is thinking:
“The market took my stop, so it must have been manipulated.”
Sometimes your stop was simply placed in an obvious location and the market naturally traded through that area.
A stop-loss is not supposed to predict the market.
It is supposed to define the amount of risk you are willing to accept.
The goal is not to place a stop where the market can never reach it.
The goal is to build a trade where the entry, invalidation level, position size, and potential reward all make sense.
Final Thought
Price traps are not magic signals.
They are a reminder that the first move is not always the real move.
The market can create fear before an uptrend, excitement before a reversal, and confidence just before invalidation.
So instead of asking:
“Where will price go next?”
Try asking:
“Who is trapped here, where is the liquidity, and what is price doing after the trap?”
That shift in perspective can completely change the way you read a chart.
Sometimes, the move that looks like a breakout is actually the setup.
And the real move begins only after the market has finished trapping the impatient traders.

Penafian
Maklumat dan penerbitan adalah tidak bertujuan, dan tidak membentuk, nasihat atau cadangan kewangan, pelaburan, dagangan atau jenis lain yang diberikan atau disahkan oleh TradingView. Baca lebih dalam Terma Penggunaan.
Penafian
Maklumat dan penerbitan adalah tidak bertujuan, dan tidak membentuk, nasihat atau cadangan kewangan, pelaburan, dagangan atau jenis lain yang diberikan atau disahkan oleh TradingView. Baca lebih dalam Terma Penggunaan.