
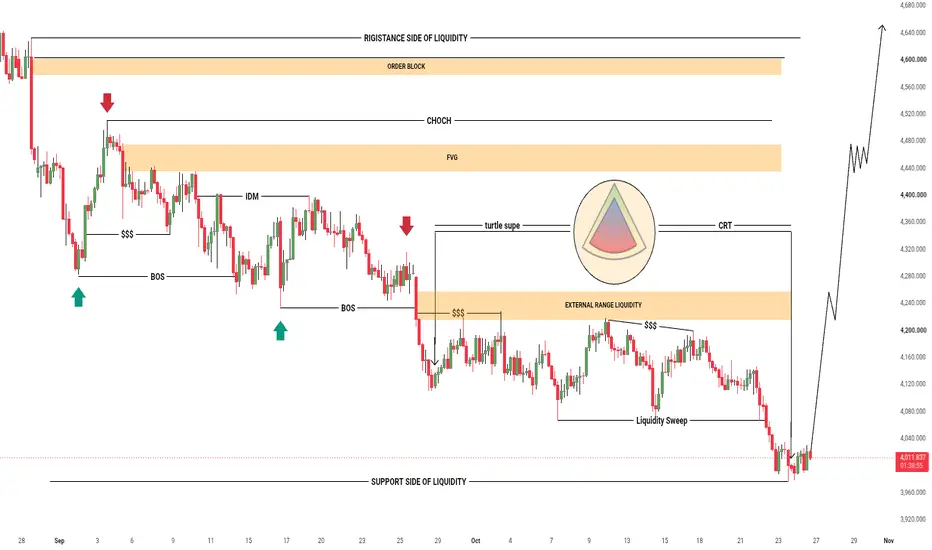
This technical analysis provides an extremely detailed, comprehensive, and in-depth breakdown of current price action mechanics, market structure dynamics, and institutional order flow principles to help traders understand complex chart patterns, liquidity distributions, and upcoming market opportunities.
Resistance Side Of Liquidity And Order Block:
The resistance side of liquidity represents key upper price boundaries where multiple stop loss orders and resting liquidity pools accumulate from market participants. An order block highlights a significant institutional supply zone where large financial entities execute heavy sell orders. These regions act as major ceilings where institutional sellers defend their positions, making them essential areas to monitor for potential trend reversals.
Change Of Character (CHOCH) And Fair Value Gap (FVG):
A change of character indicates a critical turning point where the prevailing trend direction shifts. A fair value gap denotes a market inefficiency or pricing imbalance caused by rapid, aggressive, and one-sided impulsive price movement. The market frequently returns to this fair value gap to rebalance order books before continuing its primary trend direction.
Break Of Structure (BOS) And Inducement (IDM):
A break of structure confirms the continuation of the current trend direction. Inducement refers to intermediate structural highs or lows created to trick retail traders into premature market entries by acting as a decoy level just before smart money drives the price.
Turtle Soup, External Range Liquidity, And CRT:
Turtle soup describes a short-term false breakout where prices briefly push past a swing high or low before sharply reversing direction. External range liquidity and custom range trading elements help identify where resting orders sit outside established consolidation brackets, allowing traders to spot institutional traps.
Liquidity Sweep And Support Side Of Liquidity:
A liquidity sweep occurs when prices move past previous levels to trigger resting stop losses and accumulate large-scale positions. The support side of liquidity marks lower boundary areas where buying interest accumulates, providing a solid foundation for potential price bounces and bullish continuations as mapped out by the expected upward trajectory on the chart.
Risk Disclaimer:
Trading financial markets involves substantial risk of loss and is not suitable for every investor. Valuation and prices can fluctuate widely, and traders may lose more than their initial capital. This analysis is shared strictly for educational and informational purposes only and should not be construed as professional financial advice, trade recommendations, or a direct solicitation to buy or sell any financial instrument. Always perform your own thorough research, apply strict risk management protocols, and consult with a certified financial advisor before executing any live market trades.
Resistance Side Of Liquidity And Order Block:
The resistance side of liquidity represents key upper price boundaries where multiple stop loss orders and resting liquidity pools accumulate from market participants. An order block highlights a significant institutional supply zone where large financial entities execute heavy sell orders. These regions act as major ceilings where institutional sellers defend their positions, making them essential areas to monitor for potential trend reversals.
Change Of Character (CHOCH) And Fair Value Gap (FVG):
A change of character indicates a critical turning point where the prevailing trend direction shifts. A fair value gap denotes a market inefficiency or pricing imbalance caused by rapid, aggressive, and one-sided impulsive price movement. The market frequently returns to this fair value gap to rebalance order books before continuing its primary trend direction.
Break Of Structure (BOS) And Inducement (IDM):
A break of structure confirms the continuation of the current trend direction. Inducement refers to intermediate structural highs or lows created to trick retail traders into premature market entries by acting as a decoy level just before smart money drives the price.
Turtle Soup, External Range Liquidity, And CRT:
Turtle soup describes a short-term false breakout where prices briefly push past a swing high or low before sharply reversing direction. External range liquidity and custom range trading elements help identify where resting orders sit outside established consolidation brackets, allowing traders to spot institutional traps.
Liquidity Sweep And Support Side Of Liquidity:
A liquidity sweep occurs when prices move past previous levels to trigger resting stop losses and accumulate large-scale positions. The support side of liquidity marks lower boundary areas where buying interest accumulates, providing a solid foundation for potential price bounces and bullish continuations as mapped out by the expected upward trajectory on the chart.
Trading financial markets involves substantial risk of loss and is not suitable for every investor. Valuation and prices can fluctuate widely, and traders may lose more than their initial capital. This analysis is shared strictly for educational and informational purposes only and should not be construed as professional financial advice, trade recommendations, or a direct solicitation to buy or sell any financial instrument. Always perform your own thorough research, apply strict risk management protocols, and consult with a certified financial advisor before executing any live market trades.

Join My Free Telegram Signal
t.me/+6nYwb-ri1m5mOTc0
Follw The Trend Be The 2% of People
t.me/+6nYwb-ri1m5mOTc0
Follw The Trend Be The 2% of People
Penerbitan berkaitan
Penafian
Maklumat dan penerbitan adalah tidak bertujuan, dan tidak membentuk, nasihat atau cadangan kewangan, pelaburan, dagangan atau jenis lain yang diberikan atau disahkan oleh TradingView. Baca lebih dalam Terma Penggunaan.