
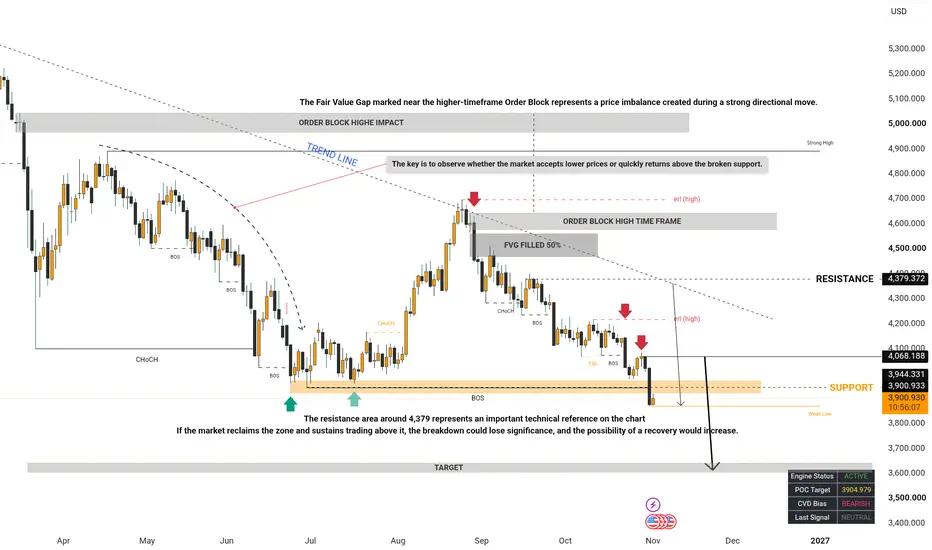
The current chart presents a strong bearish structure, with price continuing to form lower highs and lower lows after facing rejection from the higher-timeframe Order Block region.
The market previously experienced a recovery toward the upper price levels, but buying pressure failed to sustain the upward movement. Following the rejection near the higher-timeframe supply and Fair Value Gap (FVG) area, sellers regained control and pushed price lower.
The descending trendline continues to highlight the broader bearish structure. Multiple bearish Breaks of Structure (BOS) indicate that selling pressure has remained dominant, while the recent decline toward the marked support region suggests that the market is testing an important technical area.
Price has now moved below the previously marked support zone around 3,898–3,944. This breakdown is an important development because the area had previously acted as a point of support.
If price remains below this zone and fails to reclaim it, the bearish continuation scenario may gain further strength. The chart identifies a lower target region around 3,600–3,630, which represents a potential downside area to monitor if selling momentum continues.
However, a support breakdown does not guarantee uninterrupted downside movement. Price may retest the broken zone, consolidate, or temporarily recover before the next directional move becomes clear.
2. Higher-Timeframe Market Structure
From a broader market perspective, the chart shows that the previous bullish recovery failed to establish a sustained upward trend.
Price advanced toward the higher-timeframe Order Block around 4,580–4,640, where selling pressure emerged. The rejection from this region was followed by a series of bearish candles and further structural weakness.
This reaction suggests that the higher-timeframe supply area remains an important reference point for understanding the market's direction.
After the rejection, price continued to form lower highs and break previous lows. This sequence indicates that sellers have maintained control of the visible market structure.
The descending trendline reinforces this bearish outlook by connecting previous reaction highs and illustrating the broader downward pressure.
For the market to establish a meaningful bullish reversal, price would need to demonstrate a clear structural change, reclaim relevant resistance levels, and sustain buying pressure above previously broken areas.
Until such confirmation appears, the bearish structure remains the primary scenario to monitor.
3. Higher-Timeframe Order Block and Supply Zone
The chart highlights a significant higher-timeframe Order Block near 4,580–4,640.
This region previously acted as an area of selling pressure, where price failed to maintain its upward movement and subsequently declined.
Order Blocks are commonly used in Smart Money Concepts to identify areas associated with strong directional price movements. However, these zones should be evaluated alongside market structure and actual price reactions rather than treated as guaranteed reversal points.
In the current setup, the rejection from the higher-timeframe Order Block contributed to the subsequent bearish continuation.
If price eventually retraces toward this area, traders can monitor whether the market experiences another rejection or breaks above the zone with sustained momentum.
A continued rejection would be consistent with the existing bearish structure. Conversely, a strong breakout and successful retest above the zone could indicate that the broader bearish outlook is weakening.
For now, this remains an important higher-timeframe reference rather than an immediate downside target.
4. Fair Value Gap: Understanding the Price Imbalance
The Fair Value Gap marked near the higher-timeframe Order Block represents a price imbalance created during a strong directional move.
The chart indicates that approximately 50% of the highlighted FVG has been filled. This area may therefore remain relevant if price returns toward the previous imbalance.
During bearish market conditions, upward retracements can revisit FVGs before sellers attempt to continue the prevailing downward move.
However, an FVG does not guarantee that price will return to the zone or that the zone will produce a rejection.
In this analysis, the FVG is most useful when combined with the higher-timeframe Order Block, descending trendline, and bearish market structure.
If price retraces toward the marked imbalance and subsequently displays bearish confirmation, it could support the continuation scenario. If price breaks above the area and maintains bullish momentum, the bearish interpretation would need to be reassessed.
5. Resistance at 4,379: An Important Reference Level
The resistance area around 4,379 represents an important technical reference on the chart.
This level can help traders evaluate whether a potential recovery is merely a temporary retracement or the beginning of a more significant structural change.
If price moves upward but fails to reclaim this resistance area, the broader bearish structure may remain intact.
A rejection near resistance, followed by renewed bearish price action, could indicate that sellers are continuing to defend higher prices.
On the other hand, a decisive break above resistance followed by a successful retest would weaken the immediate bearish scenario and suggest that buyers may be gaining strength.
Traders should therefore monitor the reaction around this level rather than assuming that every upward movement will automatically lead to a reversal.
6. Support Breakdown Around 3,898–3,944
The support zone around 3,898–3,944 is one of the most important areas in the current analysis.
Price previously reacted from this region, making it a relevant reference point for buyers and sellers.
The latest bearish movement has pushed price below the marked support area. This indicates that the previous support has failed to hold at the time shown on the chart.
When price breaks below support, the former support area can potentially become resistance during a subsequent retest. However, this depends on how price behaves after the breakdown.
For the bearish continuation scenario to strengthen, price would ideally remain below the broken zone and demonstrate rejection when attempting to recover above it.
If the market reclaims the zone and sustains trading above it, the breakdown could lose significance, and the possibility of a recovery would increase.
The key is to observe whether the market accepts lower prices or quickly returns above the broken support.
7. Bearish Continuation Scenario
The primary scenario illustrated on the chart is a possible continuation toward the lower target region.
The bearish case is supported by several technical observations:
- The visible market structure remains bearish.
- Price has formed repeated lower highs and bearish breaks of structure.
- The descending trendline continues to indicate downward pressure.
- The higher-timeframe Order Block previously experienced a bearish reaction.
- Price has moved below the marked support zone around 3,898–3,944.
- The chart identifies a potential lower target near 3,600–3,630.
If price remains below the broken support and a retest produces further selling pressure, the market could continue toward lower levels.
The marked target region around 3,600–3,630 would then become an important area to monitor for a possible reaction.
Nevertheless, this remains a conditional scenario. Price may consolidate, recover temporarily, or form additional support before reaching the projected target.
A disciplined approach requires waiting for confirmation instead of assuming that the entire projected move will occur.
8. Alternative Scenario: Recovery Above Broken Support
Although the chart favors a bearish continuation scenario, the possibility of a bullish recovery should not be ignored.
Markets can produce temporary reversals after strong declines, especially when price reaches an area where buying interest develops.
If price quickly reclaims the 3,898–3,944 region and establishes sustained trading above it, the recent breakdown could become less reliable as a bearish continuation signal.
Further bullish confirmation would require a change in short-term market structure, including a break above a relevant lower high and a successful retest.
If these conditions develop, price could attempt to recover toward nearby resistance levels.
However, a single bullish candle or a temporary bounce is not sufficient to confirm a full trend reversal. The broader structure, relevant resistance levels, and follow-through should all be considered.
9. Key Levels to Monitor
The following levels are approximate reference areas taken from the chart:
Higher-Timeframe Order Block: 4,580–4,640
Major Resistance: Around 4,379
Previous Support Zone: 3,898–3,944
Potential Lower Target Region: 3,600–3,630
These levels serve different purposes in the analysis. The Order Block and resistance area provide context for potential upward retracements, while the broken support and lower target region help evaluate the bearish continuation scenario.
Because price can move rapidly, these zones should be reassessed as new candles form. The levels should not be treated as guaranteed entry points, stop-loss locations, or profit targets without considering the current market conditions.
10. Risk Management and Trading Discipline
Risk management is essential when trading a market that is already moving strongly in one direction.
A bearish structure can create opportunities, but entering after an extended decline can also expose traders to sudden retracements and unfavorable execution.
Before considering a position, traders should establish a clear trading plan.
First, identify the technical reason for the trade. A support breakdown, confirmed retest, or bearish rejection may provide a clearer setup than entering simply because price is falling.
Second, define the invalidation level. The trade should have a clear condition under which the original analysis is no longer valid.
Third, calculate the position size according to the planned risk. Avoid excessive leverage and ensure that a single losing trade does not cause significant damage to the trading account.
Fourth, consider the potential reward relative to the risk. A trade should not be entered merely because a distant target appears attractive.
Finally, maintain discipline. Avoid revenge trading, chasing price after a large candle, or moving a stop-loss farther away because the market is moving against the position.
The objective is not to predict every price movement. It is to identify a logical scenario, manage uncertainty, and protect capital when the market behaves differently than expected.
Final Market Outlook
The chart currently shows a bearish market structure following rejection from the higher-timeframe Order Block and continued downward movement beneath the descending trendline.
The recent breakdown below the 3,898–3,944 support region is an important development. If price remains below this area and a retest confirms that former support is acting as resistance, the bearish continuation scenario may remain valid.
Under those conditions, the lower target region around 3,600–3,630 becomes a potential area of interest.
However, the market may also produce a temporary recovery, consolidation, or a false breakdown. A sustained reclaim of the broken support and a confirmed bullish change in structure would weaken the immediate bearish outlook.
The most important factor is therefore not the direction suggested by the chart alone, but how price behaves around the key technical levels.
My trading approach is to respect the existing market structure, wait for confirmation, and avoid emotional decisions. Every trade should have a clear invalidation level, realistic expectations, and a defined risk-management plan. Patience and consistency are more important than trying to capture every market movement.
Disclaimer: This analysis is provided for educational and informational purposes only. It is not financial advice or a recommendation to buy or sell any financial instrument. Market conditions can change, and all trading involves risk. Always conduct your own research and apply appropriate risk management before making trading decisions.
The market previously experienced a recovery toward the upper price levels, but buying pressure failed to sustain the upward movement. Following the rejection near the higher-timeframe supply and Fair Value Gap (FVG) area, sellers regained control and pushed price lower.
The descending trendline continues to highlight the broader bearish structure. Multiple bearish Breaks of Structure (BOS) indicate that selling pressure has remained dominant, while the recent decline toward the marked support region suggests that the market is testing an important technical area.
Price has now moved below the previously marked support zone around 3,898–3,944. This breakdown is an important development because the area had previously acted as a point of support.
If price remains below this zone and fails to reclaim it, the bearish continuation scenario may gain further strength. The chart identifies a lower target region around 3,600–3,630, which represents a potential downside area to monitor if selling momentum continues.
However, a support breakdown does not guarantee uninterrupted downside movement. Price may retest the broken zone, consolidate, or temporarily recover before the next directional move becomes clear.
2. Higher-Timeframe Market Structure
From a broader market perspective, the chart shows that the previous bullish recovery failed to establish a sustained upward trend.
Price advanced toward the higher-timeframe Order Block around 4,580–4,640, where selling pressure emerged. The rejection from this region was followed by a series of bearish candles and further structural weakness.
This reaction suggests that the higher-timeframe supply area remains an important reference point for understanding the market's direction.
After the rejection, price continued to form lower highs and break previous lows. This sequence indicates that sellers have maintained control of the visible market structure.
The descending trendline reinforces this bearish outlook by connecting previous reaction highs and illustrating the broader downward pressure.
For the market to establish a meaningful bullish reversal, price would need to demonstrate a clear structural change, reclaim relevant resistance levels, and sustain buying pressure above previously broken areas.
Until such confirmation appears, the bearish structure remains the primary scenario to monitor.
3. Higher-Timeframe Order Block and Supply Zone
The chart highlights a significant higher-timeframe Order Block near 4,580–4,640.
This region previously acted as an area of selling pressure, where price failed to maintain its upward movement and subsequently declined.
Order Blocks are commonly used in Smart Money Concepts to identify areas associated with strong directional price movements. However, these zones should be evaluated alongside market structure and actual price reactions rather than treated as guaranteed reversal points.
In the current setup, the rejection from the higher-timeframe Order Block contributed to the subsequent bearish continuation.
If price eventually retraces toward this area, traders can monitor whether the market experiences another rejection or breaks above the zone with sustained momentum.
A continued rejection would be consistent with the existing bearish structure. Conversely, a strong breakout and successful retest above the zone could indicate that the broader bearish outlook is weakening.
For now, this remains an important higher-timeframe reference rather than an immediate downside target.
4. Fair Value Gap: Understanding the Price Imbalance
The Fair Value Gap marked near the higher-timeframe Order Block represents a price imbalance created during a strong directional move.
The chart indicates that approximately 50% of the highlighted FVG has been filled. This area may therefore remain relevant if price returns toward the previous imbalance.
During bearish market conditions, upward retracements can revisit FVGs before sellers attempt to continue the prevailing downward move.
However, an FVG does not guarantee that price will return to the zone or that the zone will produce a rejection.
In this analysis, the FVG is most useful when combined with the higher-timeframe Order Block, descending trendline, and bearish market structure.
If price retraces toward the marked imbalance and subsequently displays bearish confirmation, it could support the continuation scenario. If price breaks above the area and maintains bullish momentum, the bearish interpretation would need to be reassessed.
5. Resistance at 4,379: An Important Reference Level
The resistance area around 4,379 represents an important technical reference on the chart.
This level can help traders evaluate whether a potential recovery is merely a temporary retracement or the beginning of a more significant structural change.
If price moves upward but fails to reclaim this resistance area, the broader bearish structure may remain intact.
A rejection near resistance, followed by renewed bearish price action, could indicate that sellers are continuing to defend higher prices.
On the other hand, a decisive break above resistance followed by a successful retest would weaken the immediate bearish scenario and suggest that buyers may be gaining strength.
Traders should therefore monitor the reaction around this level rather than assuming that every upward movement will automatically lead to a reversal.
6. Support Breakdown Around 3,898–3,944
The support zone around 3,898–3,944 is one of the most important areas in the current analysis.
Price previously reacted from this region, making it a relevant reference point for buyers and sellers.
The latest bearish movement has pushed price below the marked support area. This indicates that the previous support has failed to hold at the time shown on the chart.
When price breaks below support, the former support area can potentially become resistance during a subsequent retest. However, this depends on how price behaves after the breakdown.
For the bearish continuation scenario to strengthen, price would ideally remain below the broken zone and demonstrate rejection when attempting to recover above it.
If the market reclaims the zone and sustains trading above it, the breakdown could lose significance, and the possibility of a recovery would increase.
The key is to observe whether the market accepts lower prices or quickly returns above the broken support.
7. Bearish Continuation Scenario
The primary scenario illustrated on the chart is a possible continuation toward the lower target region.
The bearish case is supported by several technical observations:
- The visible market structure remains bearish.
- Price has formed repeated lower highs and bearish breaks of structure.
- The descending trendline continues to indicate downward pressure.
- The higher-timeframe Order Block previously experienced a bearish reaction.
- Price has moved below the marked support zone around 3,898–3,944.
- The chart identifies a potential lower target near 3,600–3,630.
If price remains below the broken support and a retest produces further selling pressure, the market could continue toward lower levels.
The marked target region around 3,600–3,630 would then become an important area to monitor for a possible reaction.
Nevertheless, this remains a conditional scenario. Price may consolidate, recover temporarily, or form additional support before reaching the projected target.
A disciplined approach requires waiting for confirmation instead of assuming that the entire projected move will occur.
8. Alternative Scenario: Recovery Above Broken Support
Although the chart favors a bearish continuation scenario, the possibility of a bullish recovery should not be ignored.
Markets can produce temporary reversals after strong declines, especially when price reaches an area where buying interest develops.
If price quickly reclaims the 3,898–3,944 region and establishes sustained trading above it, the recent breakdown could become less reliable as a bearish continuation signal.
Further bullish confirmation would require a change in short-term market structure, including a break above a relevant lower high and a successful retest.
If these conditions develop, price could attempt to recover toward nearby resistance levels.
However, a single bullish candle or a temporary bounce is not sufficient to confirm a full trend reversal. The broader structure, relevant resistance levels, and follow-through should all be considered.
9. Key Levels to Monitor
The following levels are approximate reference areas taken from the chart:
Higher-Timeframe Order Block: 4,580–4,640
Major Resistance: Around 4,379
Previous Support Zone: 3,898–3,944
Potential Lower Target Region: 3,600–3,630
These levels serve different purposes in the analysis. The Order Block and resistance area provide context for potential upward retracements, while the broken support and lower target region help evaluate the bearish continuation scenario.
Because price can move rapidly, these zones should be reassessed as new candles form. The levels should not be treated as guaranteed entry points, stop-loss locations, or profit targets without considering the current market conditions.
10. Risk Management and Trading Discipline
Risk management is essential when trading a market that is already moving strongly in one direction.
A bearish structure can create opportunities, but entering after an extended decline can also expose traders to sudden retracements and unfavorable execution.
Before considering a position, traders should establish a clear trading plan.
First, identify the technical reason for the trade. A support breakdown, confirmed retest, or bearish rejection may provide a clearer setup than entering simply because price is falling.
Second, define the invalidation level. The trade should have a clear condition under which the original analysis is no longer valid.
Third, calculate the position size according to the planned risk. Avoid excessive leverage and ensure that a single losing trade does not cause significant damage to the trading account.
Fourth, consider the potential reward relative to the risk. A trade should not be entered merely because a distant target appears attractive.
Finally, maintain discipline. Avoid revenge trading, chasing price after a large candle, or moving a stop-loss farther away because the market is moving against the position.
The objective is not to predict every price movement. It is to identify a logical scenario, manage uncertainty, and protect capital when the market behaves differently than expected.
Final Market Outlook
The chart currently shows a bearish market structure following rejection from the higher-timeframe Order Block and continued downward movement beneath the descending trendline.
The recent breakdown below the 3,898–3,944 support region is an important development. If price remains below this area and a retest confirms that former support is acting as resistance, the bearish continuation scenario may remain valid.
Under those conditions, the lower target region around 3,600–3,630 becomes a potential area of interest.
However, the market may also produce a temporary recovery, consolidation, or a false breakdown. A sustained reclaim of the broken support and a confirmed bullish change in structure would weaken the immediate bearish outlook.
The most important factor is therefore not the direction suggested by the chart alone, but how price behaves around the key technical levels.
My trading approach is to respect the existing market structure, wait for confirmation, and avoid emotional decisions. Every trade should have a clear invalidation level, realistic expectations, and a defined risk-management plan. Patience and consistency are more important than trying to capture every market movement.
Disclaimer: This analysis is provided for educational and informational purposes only. It is not financial advice or a recommendation to buy or sell any financial instrument. Market conditions can change, and all trading involves risk. Always conduct your own research and apply appropriate risk management before making trading decisions.
Dagangan aktif

Join my telegram daily signal 90% accurate
t.me/+CcKfRimfqMxiOWRk
Join my Telegram
t.me/+-af0b-qg4l41ZWI8
t.me/+CcKfRimfqMxiOWRk
Join my Telegram
t.me/+-af0b-qg4l41ZWI8
Penerbitan berkaitan
Penafian
Maklumat dan penerbitan adalah tidak bertujuan, dan tidak membentuk, nasihat atau cadangan kewangan, pelaburan, dagangan atau jenis lain yang diberikan atau disahkan oleh TradingView. Baca lebih dalam Terma Penggunaan.
Join my telegram daily signal 90% accurate
t.me/+CcKfRimfqMxiOWRk
Join my Telegram
t.me/+-af0b-qg4l41ZWI8
t.me/+CcKfRimfqMxiOWRk
Join my Telegram
t.me/+-af0b-qg4l41ZWI8
Penerbitan berkaitan
Penafian
Maklumat dan penerbitan adalah tidak bertujuan, dan tidak membentuk, nasihat atau cadangan kewangan, pelaburan, dagangan atau jenis lain yang diberikan atau disahkan oleh TradingView. Baca lebih dalam Terma Penggunaan.