
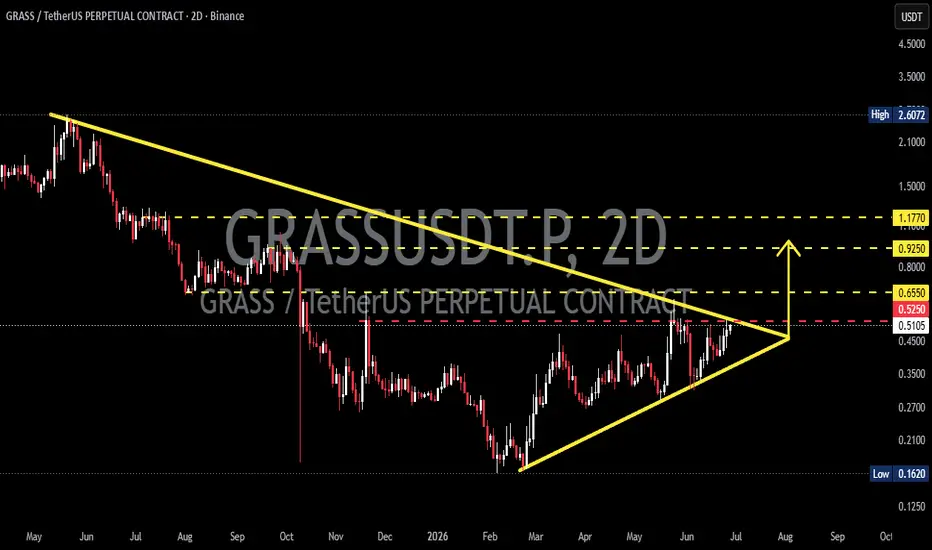
On the 2-Day (2D) timeframe, GRASSUSDT is forming a Symmetrical Triangle pattern after experiencing a prolonged downtrend. The price is now approaching the apex (tip of the triangle), which is typically a critical area before a significant move occurs.
📌 This pattern indicates that buying 🟢 and selling 🔴 pressure is becoming increasingly balanced. The closer the price gets to the apex, the greater the probability of a breakout, accompanied by increased volatility. ⚡
At the moment, the price remains just below the major resistance level around 0.5250 USDT, which also aligns with the triangle's descending resistance line.
---
🔺 Pattern Overview: Symmetrical Triangle
📐 A Symmetrical Triangle is a consolidation pattern formed by:
📉 Lower Highs (descending resistance)
📈 Higher Lows (ascending support)
💡 This pattern does not inherently predict the next direction. However, it often leads to a strong price movement once the market breaks out of the triangle with increasing trading volume.
⚡ The longer the price consolidates within the pattern, the stronger the potential move after the breakout.
---
🟢 Bullish Scenario
✅ The bullish outlook becomes more convincing if:
🟢 A 2D candle breaks out and closes above the Symmetrical Triangle resistance.
📊 The breakout is supported by a noticeable increase in trading volume.
🎯 If the breakout is confirmed, the next upside targets are:
🥇 Target 1: 0.6550 USDT
🥈 Target 2: 0.9250 USDT
🥉 Target 3: 1.1770 USDT
🚀 As long as the price holds above the breakout area, the probability of continuing the upward trend increases significantly.
---
🔴 Bearish Scenario
⚠️ A bearish scenario should still be considered if:
❌ The price fails to break above the triangle resistance.
❌ A strong rejection occurs around the 0.5250 USDT resistance area.
❌ The price falls back and breaks below the Symmetrical Triangle support.
📉 If a breakdown occurs, selling pressure could regain control, potentially pushing the price back toward previous support levels.
🚨 Traders should also be cautious of a fake breakout, as the price is currently trading very close to the triangle's apex.
---
⚠️ Key Things to Watch
👀 Focus on the 2-Day candle close, not just a temporary wick above resistance.
📊 Trading volume is a crucial factor in confirming the validity of either a breakout or a breakdown.
⚡ The closer the price gets to the apex, the higher the probability of a sharp volatility expansion.
🛡️ Always apply proper risk management, as breakouts without strong volume confirmation can easily turn into fakeouts.
---
📌 Conclusion
📍 GRASSUSDT is currently at a decisive stage after forming a Symmetrical Triangle on the 2-Day timeframe.
🔑 The 0.5250 USDT area is the key level that will determine whether the price can initiate a bullish reversal toward higher targets or resume its broader downtrend.
✅ Traders are advised to wait for a confirmed breakout or breakdown before entering a position, reducing the risk of being trapped in a fake breakout.
---
#GRASS #GRASSUSDT #Crypto #Cryptocurrency #TechnicalAnalysis #SymmetricalTriangle #Breakout #Breakdown #Bullish #Bearish #Altcoins #CryptoTrading #PriceAction #SupportResistance #ChartAnalysis #RiskManagement #VolumeAnalysis #TradeSetup
📌 This pattern indicates that buying 🟢 and selling 🔴 pressure is becoming increasingly balanced. The closer the price gets to the apex, the greater the probability of a breakout, accompanied by increased volatility. ⚡
At the moment, the price remains just below the major resistance level around 0.5250 USDT, which also aligns with the triangle's descending resistance line.
---
🔺 Pattern Overview: Symmetrical Triangle
📐 A Symmetrical Triangle is a consolidation pattern formed by:
📉 Lower Highs (descending resistance)
📈 Higher Lows (ascending support)
💡 This pattern does not inherently predict the next direction. However, it often leads to a strong price movement once the market breaks out of the triangle with increasing trading volume.
⚡ The longer the price consolidates within the pattern, the stronger the potential move after the breakout.
---
🟢 Bullish Scenario
✅ The bullish outlook becomes more convincing if:
🟢 A 2D candle breaks out and closes above the Symmetrical Triangle resistance.
📊 The breakout is supported by a noticeable increase in trading volume.
🎯 If the breakout is confirmed, the next upside targets are:
🥇 Target 1: 0.6550 USDT
🥈 Target 2: 0.9250 USDT
🥉 Target 3: 1.1770 USDT
🚀 As long as the price holds above the breakout area, the probability of continuing the upward trend increases significantly.
---
🔴 Bearish Scenario
⚠️ A bearish scenario should still be considered if:
❌ The price fails to break above the triangle resistance.
❌ A strong rejection occurs around the 0.5250 USDT resistance area.
❌ The price falls back and breaks below the Symmetrical Triangle support.
📉 If a breakdown occurs, selling pressure could regain control, potentially pushing the price back toward previous support levels.
🚨 Traders should also be cautious of a fake breakout, as the price is currently trading very close to the triangle's apex.
---
⚠️ Key Things to Watch
👀 Focus on the 2-Day candle close, not just a temporary wick above resistance.
📊 Trading volume is a crucial factor in confirming the validity of either a breakout or a breakdown.
⚡ The closer the price gets to the apex, the higher the probability of a sharp volatility expansion.
🛡️ Always apply proper risk management, as breakouts without strong volume confirmation can easily turn into fakeouts.
---
📌 Conclusion
📍 GRASSUSDT is currently at a decisive stage after forming a Symmetrical Triangle on the 2-Day timeframe.
🔑 The 0.5250 USDT area is the key level that will determine whether the price can initiate a bullish reversal toward higher targets or resume its broader downtrend.
✅ Traders are advised to wait for a confirmed breakout or breakdown before entering a position, reducing the risk of being trapped in a fake breakout.
---
#GRASS #GRASSUSDT #Crypto #Cryptocurrency #TechnicalAnalysis #SymmetricalTriangle #Breakout #Breakdown #Bullish #Bearish #Altcoins #CryptoTrading #PriceAction #SupportResistance #ChartAnalysis #RiskManagement #VolumeAnalysis #TradeSetup

✅ Get Free Signals! Join Our Telegram Channel Here: t.me/TheCryptoNuclear
✅ Twitter: twitter.com/crypto_nuclear
✅ Join Bybit : partner.bybit.com/b/nuclearvip
✅ Benefits : Lifetime Trading Fee Discount -50%
✅ Twitter: twitter.com/crypto_nuclear
✅ Join Bybit : partner.bybit.com/b/nuclearvip
✅ Benefits : Lifetime Trading Fee Discount -50%
Penafian
Maklumat dan penerbitan adalah tidak bertujuan, dan tidak membentuk, nasihat atau cadangan kewangan, pelaburan, dagangan atau jenis lain yang diberikan atau disahkan oleh TradingView. Baca lebih dalam Terma Penggunaan.
✅ Get Free Signals! Join Our Telegram Channel Here: t.me/TheCryptoNuclear
✅ Twitter: twitter.com/crypto_nuclear
✅ Join Bybit : partner.bybit.com/b/nuclearvip
✅ Benefits : Lifetime Trading Fee Discount -50%
✅ Twitter: twitter.com/crypto_nuclear
✅ Join Bybit : partner.bybit.com/b/nuclearvip
✅ Benefits : Lifetime Trading Fee Discount -50%
Penafian
Maklumat dan penerbitan adalah tidak bertujuan, dan tidak membentuk, nasihat atau cadangan kewangan, pelaburan, dagangan atau jenis lain yang diberikan atau disahkan oleh TradingView. Baca lebih dalam Terma Penggunaan.