
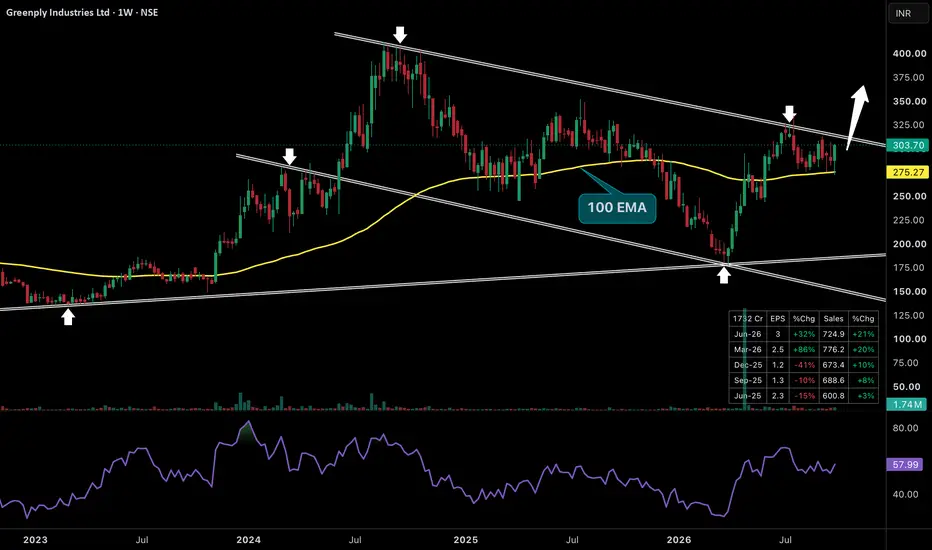
Greenply is sitting at a very important point in its long-term structure. After topping near 400 the stock spent almost two years under a falling trendline with every major recovery facing supply near this resistance. But the correction towards 180-190 in 2026 changed the character completely. Price reversed aggressively from the major rising support and recovered back above the 100 EMA around 275. Since then every dip near this moving average has attracted buyers and price is again pressing against the same multi-year falling resistance around 305-320. The latest consolidation is happening right below this trendline instead of price getting rejected deeply which shows sellers are slowly losing their grip. Even the numbers shown on the chart are improving with Jun-26 sales up 21% and EPS up 32%.
Now 315-325 becomes the major confirmation zone. A strong weekly breakout and sustain above this area can finally break the lower-high structure that has controlled Greenply since its 2024 peak. There is liquidity sitting above the recent highs and a breakout can trap traders who are still expecting another rejection from this trendline. Once that supply gets absorbed the stock can quickly attempt 350-360 and then the previous major high around 400. More importantly the rising long-term support is still intact while price is holding above the 100 EMA. This combination of improving momentum, strong support and pressure against a multi-year resistance makes the structure very interesting. One clean breakout can shift Greenply from recovery mode into a fresh bullish expansion phase.
Now 315-325 becomes the major confirmation zone. A strong weekly breakout and sustain above this area can finally break the lower-high structure that has controlled Greenply since its 2024 peak. There is liquidity sitting above the recent highs and a breakout can trap traders who are still expecting another rejection from this trendline. Once that supply gets absorbed the stock can quickly attempt 350-360 and then the previous major high around 400. More importantly the rising long-term support is still intact while price is holding above the 100 EMA. This combination of improving momentum, strong support and pressure against a multi-year resistance makes the structure very interesting. One clean breakout can shift Greenply from recovery mode into a fresh bullish expansion phase.

📌 Join Trading Community 👇
Telegram : 👉telegram.me/chartifyy
Instagram: 👉 instagram.com/chartifyig?igsi=Y2ZiODZtczZ2aDA=&utm_source=qr
Telegram : 👉telegram.me/chartifyy
Instagram: 👉 instagram.com/chartifyig?igsi=Y2ZiODZtczZ2aDA=&utm_source=qr
Penafian
Maklumat dan penerbitan adalah tidak bertujuan, dan tidak membentuk, nasihat atau cadangan kewangan, pelaburan, dagangan atau jenis lain yang diberikan atau disahkan oleh TradingView. Baca lebih dalam Terma Penggunaan.
📌 Join Trading Community 👇
Telegram : 👉telegram.me/chartifyy
Instagram: 👉 instagram.com/chartifyig?igsi=Y2ZiODZtczZ2aDA=&utm_source=qr
Telegram : 👉telegram.me/chartifyy
Instagram: 👉 instagram.com/chartifyig?igsi=Y2ZiODZtczZ2aDA=&utm_source=qr
Penafian
Maklumat dan penerbitan adalah tidak bertujuan, dan tidak membentuk, nasihat atau cadangan kewangan, pelaburan, dagangan atau jenis lain yang diberikan atau disahkan oleh TradingView. Baca lebih dalam Terma Penggunaan.