
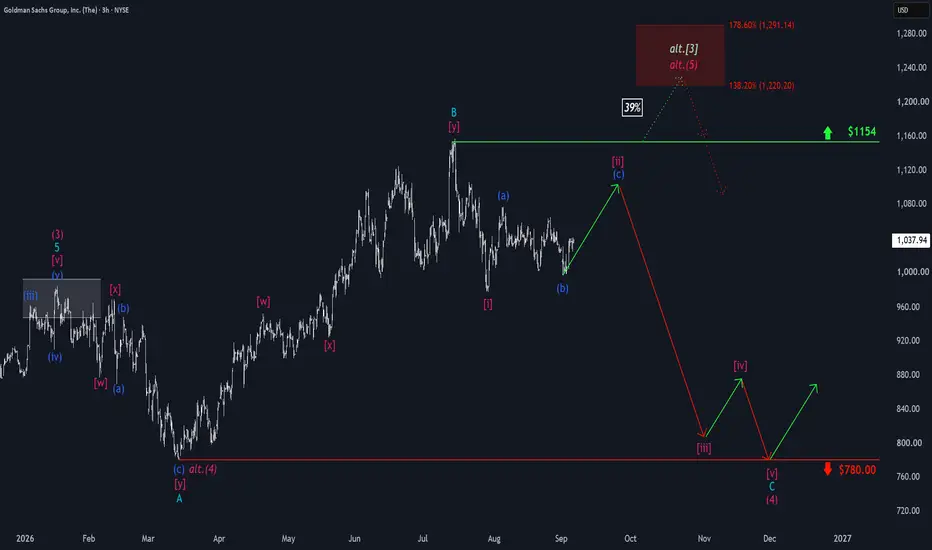
On the first trading day of September, the Goldman Sachs stock slipped just below the $1,000 mark but has since worked its way higher again. Our primary expectation is that the stock is still completing a temporary corrective move to the upside, which should end well below the resistance at $1,154. The price should then decline in stages and form the broader corrective low no later than around the support at $780.00. Once that low is in place, fresh upward moves should unfold. Alternatively, GS could be in the final phase of a broader impulsive move. In that scenario, the stock would break directly above the resistance at $1,154 and advance into our alternative red Target Zone between $1,220.20 and $1,291.14 (probability: 39%). This should then be followed by a significant sell-off as well.

📊 Daily market insights combining macro + Elliott Wave analysis
🚀 Spot trends early with momentum, sentiment & price structure
🌐 Join thousands trading smarter at hkcmglobal.com
🚀 Spot trends early with momentum, sentiment & price structure
🌐 Join thousands trading smarter at hkcmglobal.com
Penerbitan berkaitan
Penafian
Maklumat dan penerbitan adalah tidak bertujuan, dan tidak membentuk, nasihat atau cadangan kewangan, pelaburan, dagangan atau jenis lain yang diberikan atau disahkan oleh TradingView. Baca lebih dalam Terma Penggunaan.
📊 Daily market insights combining macro + Elliott Wave analysis
🚀 Spot trends early with momentum, sentiment & price structure
🌐 Join thousands trading smarter at hkcmglobal.com
🚀 Spot trends early with momentum, sentiment & price structure
🌐 Join thousands trading smarter at hkcmglobal.com
Penerbitan berkaitan
Penafian
Maklumat dan penerbitan adalah tidak bertujuan, dan tidak membentuk, nasihat atau cadangan kewangan, pelaburan, dagangan atau jenis lain yang diberikan atau disahkan oleh TradingView. Baca lebih dalam Terma Penggunaan.