
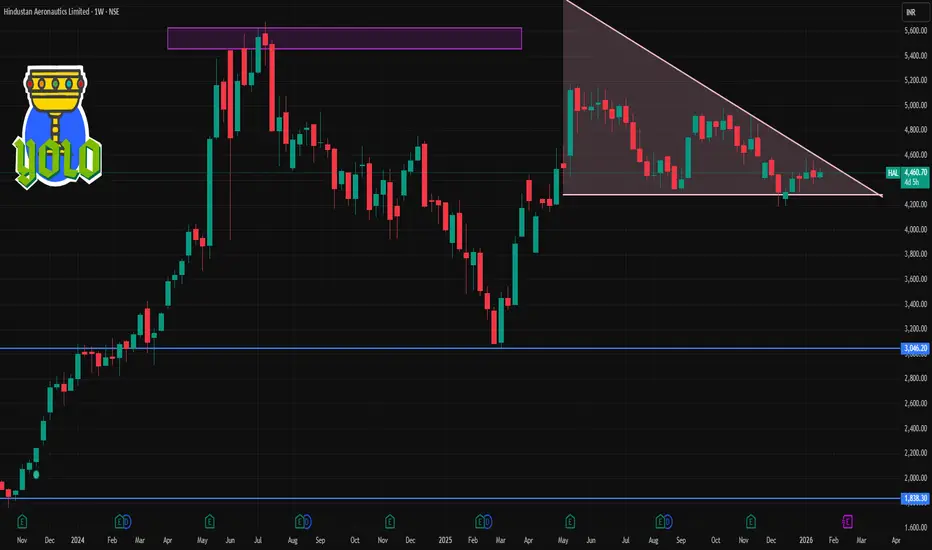
📌 Current Approximate Price
HAL’s latest price is around ₹4,440 – ₹4,480 on NSE (varies with live market moves).
📊 Weekly Technical Levels (1‑Week View)
📈 Resistance Levels (Upside)
These are levels where price may struggle to break above on the weekly timeframe:
R1 (Immediate): ~₹4,500 – ₹4,550 — first resistance zone.
R2 (Medium): ~₹4,540 – ₹4,580 — next resistance cluster.
R3 (Bullish / extended): ~₹4,580 – ₹4,670 — higher resistance if buyers take control.
Key breakout barrier to watch: sustaining above ₹4,580–₹4,600 may strengthen bullish bias for the week.
📉 Support Levels (Downside)
These are levels where price may find buying interest if it declines:
S1 (Immediate): ~₹4,420 – ₹4,380 — first support for this week.
S2 (Secondary): ~₹4,380 – ₹4,340 — deeper support if sellers push lower.
S3 (Lower): ~₹4,340 – ₹4,300 — key demand zone historically.
Key downside pivot: break below ~₹4,380 could extend selling into the ₹4,300 area.
📐 Weekly Pivot Reference
Pivot Point: ~₹4,460 – ₹4,470 — midpoint reference level for direction bias.
Above this pivot → bullish bias
Below this pivot → bearish/neutral bias
📝 Summary Weekly Levels Table
Level Price Zone
🟥 R3 ~₹4,580 – ₹4,670
🟧 R2 ~₹4,540 – ₹4,580
🟨 R1 ~₹4,500 – ₹4,550
⚪ Pivot ~₹4,460 – ₹4,470
🟦 S1 ~₹4,420 – ₹4,380
🟩 S2 ~₹4,380 – ₹4,340
🟪 S3 ~₹4,340 – ₹4,300

Contact Knowledgehub for a detailed consultation: Dm on WhatsApp: [wa.link/a2o0kz]-
Phone No: [+91 93102 26243]-
Email: [tradingviewknowledgehub@gmail.com]---
-- Let’s achieve success together!
Phone No: [+91 93102 26243]-
Email: [tradingviewknowledgehub@gmail.com]---
-- Let’s achieve success together!
Penerbitan berkaitan
Penafian
Maklumat dan penerbitan adalah tidak bertujuan, dan tidak membentuk, nasihat atau cadangan kewangan, pelaburan, dagangan atau jenis lain yang diberikan atau disahkan oleh TradingView. Baca lebih dalam Terma Penggunaan.