
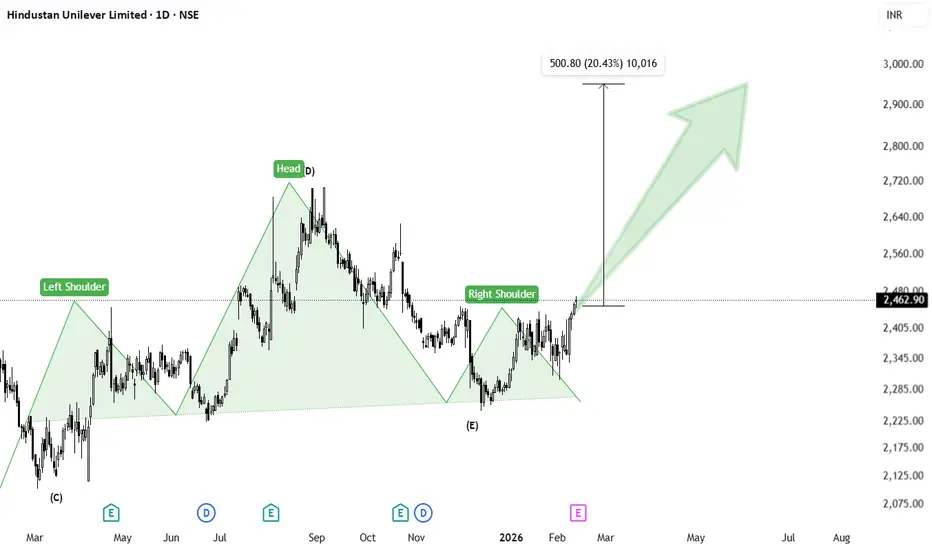
Hindustan Unilever – Failed Head & Shoulders Turning Bullish (Daily Chart)
On the daily timeframe, Hindustan Unilever was forming a well-structured Head & Shoulders pattern. The left shoulder, head, and right shoulder were clearly visible, with a defined neckline acting as support.
However, instead of breaking below the neckline, price action failed to confirm the bearish reversal. The right shoulder did not lead to downside continuation. Instead, price reversed strongly and has now given a decisive breakout above the right shoulder high, closing above that level.
This failure of a bearish Head & Shoulders pattern indicates a potential bullish reversal. Failed patterns often lead to strong moves in the opposite direction, as trapped short sellers exit their positions.
Target Measurement:
The projected upside target is calculated by measuring the vertical distance from the Head (highest point) down to the neckline low. This distance is then projected upward from the breakout point above the right shoulder.
Price has already given a confirmed daily close above the right shoulder resistance, validating the breakout.
As long as price sustains above the breakout level, the measured move target remains active.
On the daily timeframe, Hindustan Unilever was forming a well-structured Head & Shoulders pattern. The left shoulder, head, and right shoulder were clearly visible, with a defined neckline acting as support.
However, instead of breaking below the neckline, price action failed to confirm the bearish reversal. The right shoulder did not lead to downside continuation. Instead, price reversed strongly and has now given a decisive breakout above the right shoulder high, closing above that level.
This failure of a bearish Head & Shoulders pattern indicates a potential bullish reversal. Failed patterns often lead to strong moves in the opposite direction, as trapped short sellers exit their positions.
Target Measurement:
The projected upside target is calculated by measuring the vertical distance from the Head (highest point) down to the neckline low. This distance is then projected upward from the breakout point above the right shoulder.
Price has already given a confirmed daily close above the right shoulder resistance, validating the breakout.
As long as price sustains above the breakout level, the measured move target remains active.
Nota
sl 2250, tp 2900Dagangan ditutup: hentian tercapai

Penafian
Maklumat dan penerbitan adalah tidak bertujuan, dan tidak membentuk, nasihat atau cadangan kewangan, pelaburan, dagangan atau jenis lain yang diberikan atau disahkan oleh TradingView. Baca lebih dalam Terma Penggunaan.
Penafian
Maklumat dan penerbitan adalah tidak bertujuan, dan tidak membentuk, nasihat atau cadangan kewangan, pelaburan, dagangan atau jenis lain yang diberikan atau disahkan oleh TradingView. Baca lebih dalam Terma Penggunaan.