
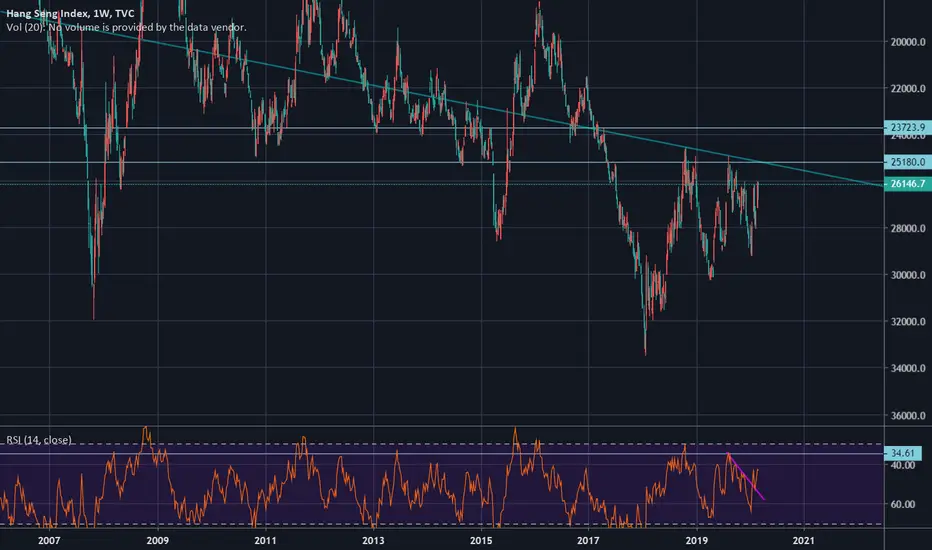
While everyone is trying catch a bottom, the HSI Inverted Weekly Chart gives a bearish view on the Hang Seng Index.
The candles from the last three weeks are bearish:
1) A Reversal Red Candle
2) A Gap with Solid Long Red Candle
3) Green Candle with Long Wick
In the coming two weeks it may hit and test the weekly support line at around 25180.
Let's see how the market reacts to the support level.
If selling is strong, it may break below 24000.

Penafian
Maklumat dan penerbitan adalah tidak bertujuan, dan tidak membentuk, nasihat atau cadangan kewangan, pelaburan, dagangan atau jenis lain yang diberikan atau disahkan oleh TradingView. Baca lebih dalam Terma Penggunaan.
Penafian
Maklumat dan penerbitan adalah tidak bertujuan, dan tidak membentuk, nasihat atau cadangan kewangan, pelaburan, dagangan atau jenis lain yang diberikan atau disahkan oleh TradingView. Baca lebih dalam Terma Penggunaan.