
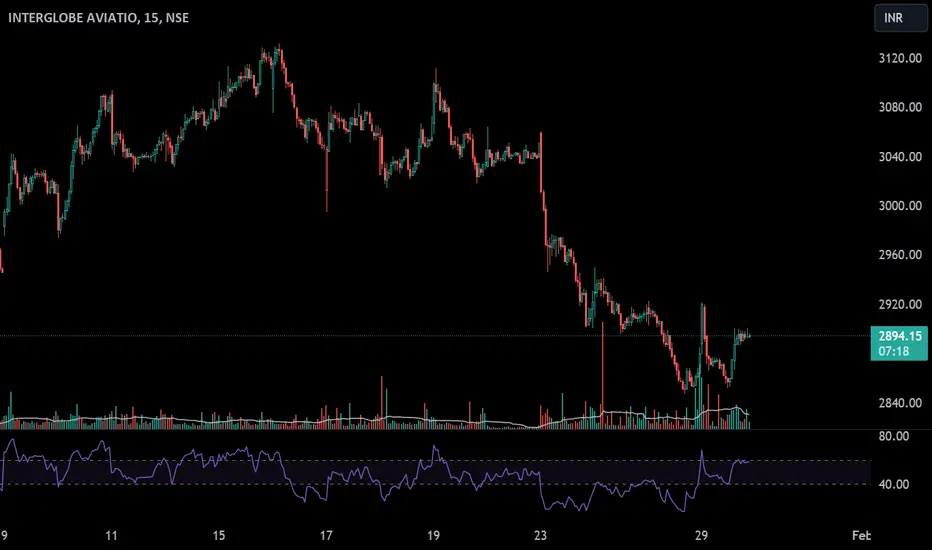
Auropharma is looking on the verge of a breakout due to following reasons:
1. Monthly, Weekly, Daily, Hourly RSI >60.
2. Ascending Triangle formation on hourly/ 15mins chart.
3. 15mins RSI is flirting around 60 which shows the underlying strength.
4. Volume profile shows accumulation is almost complete at slightly lower levels.
5. Underlying current in the pharma sector.
6. Underlying strength in the stock market.
1. Monthly, Weekly, Daily, Hourly RSI >60.
2. Ascending Triangle formation on hourly/ 15mins chart.
3. 15mins RSI is flirting around 60 which shows the underlying strength.
4. Volume profile shows accumulation is almost complete at slightly lower levels.
5. Underlying current in the pharma sector.
6. Underlying strength in the stock market.

Penafian
Maklumat dan penerbitan adalah tidak bertujuan, dan tidak membentuk, nasihat atau cadangan kewangan, pelaburan, dagangan atau jenis lain yang diberikan atau disahkan oleh TradingView. Baca lebih dalam Terma Penggunaan.
Penafian
Maklumat dan penerbitan adalah tidak bertujuan, dan tidak membentuk, nasihat atau cadangan kewangan, pelaburan, dagangan atau jenis lain yang diberikan atau disahkan oleh TradingView. Baca lebih dalam Terma Penggunaan.