 Innova Captab LimitedTelah dikemas kini
INNOVACAP Weekly Resistance Breakout Signals Long Opportunity
Bias: Long
Duration: 4 to 12 weeks (Medium-term swing trade)
Technical Analysis:
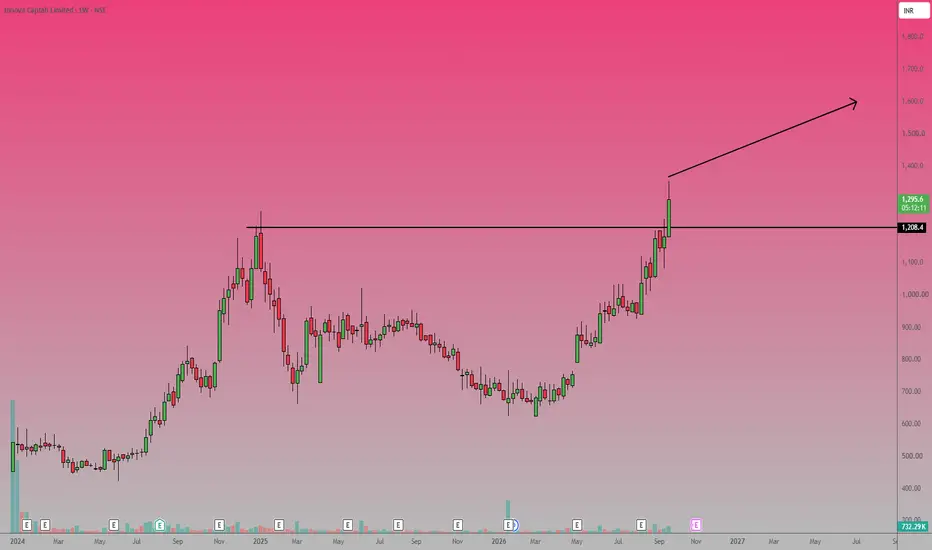
The weekly chart of Innova Captab Limited demonstrates a strong bullish breakout.
Price action has decisively crossed above a major horizontal resistance level at 1,208.4.
The stock spent the majority of 2024 and 2025 building a broad rounding base, followed by a steady higher-low accumulation phase.
The most recent weekly candle confirms the breakout, having opened at 1,179.8, hit a high of 1,353.5, and settled around 1,297.4 with a +9.97% gain.
This structural shift suggests the stock is entering a new markup phase above prior resistance.
Trade Setup:
Entry Point: Initiate a long position near the current market price of 1,297.4.
Alternatively, accumulate on a pullback to the 1,208.4 level, which is expected to flip from resistance to support.
Target: Set a primary profit target at 1,600, with a secondary target of 1,800 based on measuring the depth of the prior consolidation range.
Stop Loss: Place a hard stop loss at 1,050 (below the most recent pre-breakout consolidation phase) to invalidate the setup and protect against a false breakout.
Duration: 4 to 12 weeks (Medium-term swing trade)
Technical Analysis:
The weekly chart of Innova Captab Limited demonstrates a strong bullish breakout.
Price action has decisively crossed above a major horizontal resistance level at 1,208.4.
The stock spent the majority of 2024 and 2025 building a broad rounding base, followed by a steady higher-low accumulation phase.
The most recent weekly candle confirms the breakout, having opened at 1,179.8, hit a high of 1,353.5, and settled around 1,297.4 with a +9.97% gain.
This structural shift suggests the stock is entering a new markup phase above prior resistance.
Trade Setup:
Entry Point: Initiate a long position near the current market price of 1,297.4.
Alternatively, accumulate on a pullback to the 1,208.4 level, which is expected to flip from resistance to support.
Target: Set a primary profit target at 1,600, with a secondary target of 1,800 based on measuring the depth of the prior consolidation range.
Stop Loss: Place a hard stop loss at 1,050 (below the most recent pre-breakout consolidation phase) to invalidate the setup and protect against a false breakout.
Dagangan ditutup: hentian tercapai
Stop-Loss Hit...
Penafian
Maklumat dan penerbitan adalah tidak bertujuan, dan tidak membentuk, nasihat atau cadangan kewangan, pelaburan, dagangan atau jenis lain yang diberikan atau disahkan oleh TradingView. Baca lebih dalam Terma Penggunaan.
Penafian
Maklumat dan penerbitan adalah tidak bertujuan, dan tidak membentuk, nasihat atau cadangan kewangan, pelaburan, dagangan atau jenis lain yang diberikan atau disahkan oleh TradingView. Baca lebih dalam Terma Penggunaan.