
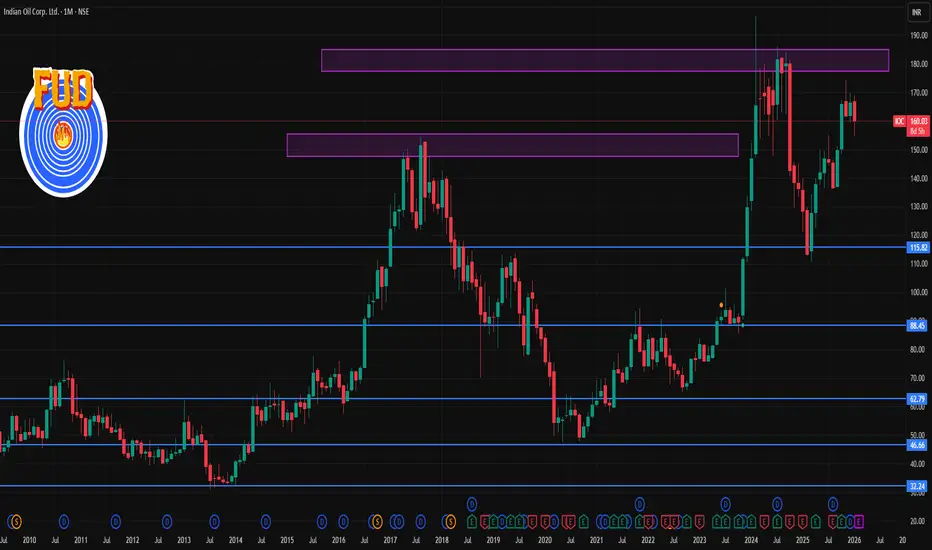
📌 CURRENT PRICE (as of 22 Jan 2026)
IOC share price: ~₹159.9 per share (NSE/BSE).
📊 1‑Month Technical Levels (Current & Accurate)
Resistance (Upside Levels)
These are levels where price may find selling pressure in the near term:
R1 – Immediate Resistance: ~₹160.6–₹162.5
R2 – Mid Resistance: ~₹162.5–₹163.9
R3 – Higher Resistance: ~₹164–₹165.2
A broader longer‑range resistance zone near ₹170–₹171+ remains significant if the market strengthens.
Why these matter:
Resistance levels show where the stock has historically paused or reversed on recent charts — useful for targets or exits.
Support (Downside Levels)
These are key near‑term supporting price zones:
S1 – Immediate Support: ~₹156.8–₹159.4
S2 – Secondary Support: ~₹154.7–₹157.9
S3 – Deeper Support: ~₹152.9–₹155.0
Note: If price breaks below ~₹155, it could signal further weakness in the short term.
🧠 How to Use These Levels
Swing traders: Use support zones for entry zones and resistance levels as targets.
Breakouts: A clear close above ₹164–₹165 could open room toward the ₹170+ zone.
Breakdown: A close below ₹155 could escalate selling into deeper support.

Contact Knowledgehub for a detailed consultation: Dm on WhatsApp: [wa.link/a2o0kz]-
Phone No: [+91 93102 26243]-
Email: [tradingviewknowledgehub@gmail.com]---
-- Let’s achieve success together!
Phone No: [+91 93102 26243]-
Email: [tradingviewknowledgehub@gmail.com]---
-- Let’s achieve success together!
Penerbitan berkaitan
Penafian
Maklumat dan penerbitan adalah tidak bertujuan, dan tidak membentuk, nasihat atau cadangan kewangan, pelaburan, dagangan atau jenis lain yang diberikan atau disahkan oleh TradingView. Baca lebih dalam Terma Penggunaan.