
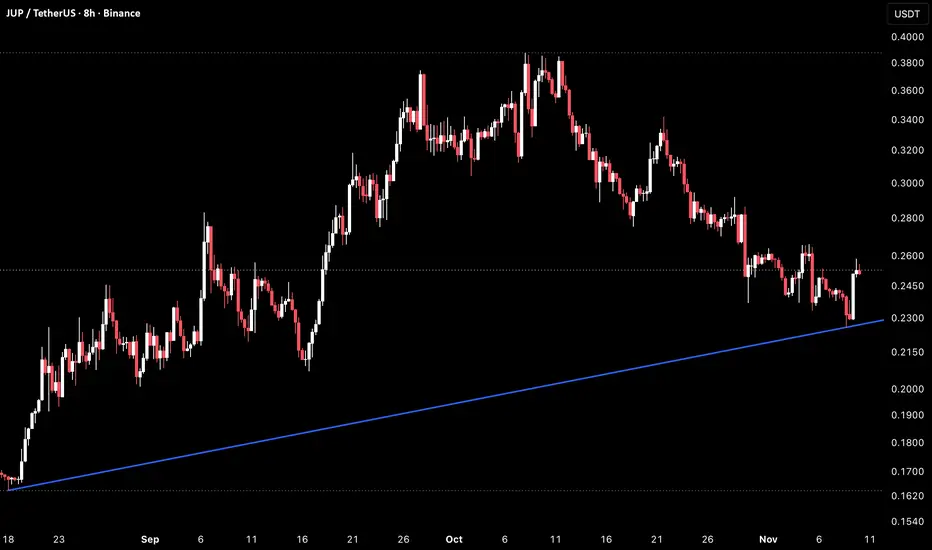
Jupiter is trading around 0.2511 on the 8H timeframe after a vertical candle off the ascending trendline near 0.2255, with price recovering back to the horizontal level near 0.2511 following a steady decline from the October high near 0.3880.
The structure here began with the August 17 low near 0.1650, where the rising trendline originates. JUP spiked to 0.2830 in early September, pulled back to 0.2005, and held the 0.2060 low on September 17 before breaking out through 0.2800 and 0.3400 to a high near 0.3750 on September 28. A second push tagged 0.3880 on October 10 and was rejected, and the decline since has been steady, printing lower highs near 0.3425, 0.2920, and 0.2660. The October 30 flush dropped through 0.2450 to 0.2375, and the November 8 wick tagged the trendline near 0.2255 before the vertical candle reversed the move.
Price is currently pressing 0.2511 after that bounce, with the 0.2660 lower high as the next resistance and the 0.2450 level as the first support.
Key Levels To Watch:
→ 0.3880 October 10 high, breakout extension top
→ 0.3425 October 21 lower high, major resistance
→ 0.2920 October 28 lower high, first major target on a bounce
→ 0.2660 November 5 lower high, first level to reclaim
→ 0.2511 Current price, pressing horizontal level
→ 0.2450 Prior support, first level to hold
→ 0.2375 October 30 wick low, near term support
→ 0.2255 November 8 wick low, trendline support
→ 0.2060 September 17 low, deeper support
→ 0.1650 Trendline origin, August 17 low
A hold of 0.2450 and a reclaim of 0.2660 would confirm the trendline bounce and break the series of lower highs, setting up a rotation toward 0.2920, with a break above it putting the 0.3425 lower high back in view.
Losing 0.2450 would bring the 0.2375 and 0.2255 wick lows back into focus, and a loss of the trendline would be the first real break of structure since August, exposing 0.2060 as the next support with a deeper retracement if that level fails.
Hold 0.2450 and the trendline and JUP builds toward the lower highs above. Lose 0.2255 and this pullback extends toward lower support.
Bias stays neutral to cautiously bullish given the clean trendline bounce, but the series of lower highs means 0.2660 needs to be reclaimed to confirm the next leg higher.
The structure here began with the August 17 low near 0.1650, where the rising trendline originates. JUP spiked to 0.2830 in early September, pulled back to 0.2005, and held the 0.2060 low on September 17 before breaking out through 0.2800 and 0.3400 to a high near 0.3750 on September 28. A second push tagged 0.3880 on October 10 and was rejected, and the decline since has been steady, printing lower highs near 0.3425, 0.2920, and 0.2660. The October 30 flush dropped through 0.2450 to 0.2375, and the November 8 wick tagged the trendline near 0.2255 before the vertical candle reversed the move.
Price is currently pressing 0.2511 after that bounce, with the 0.2660 lower high as the next resistance and the 0.2450 level as the first support.
Key Levels To Watch:
→ 0.3880 October 10 high, breakout extension top
→ 0.3425 October 21 lower high, major resistance
→ 0.2920 October 28 lower high, first major target on a bounce
→ 0.2660 November 5 lower high, first level to reclaim
→ 0.2511 Current price, pressing horizontal level
→ 0.2450 Prior support, first level to hold
→ 0.2375 October 30 wick low, near term support
→ 0.2255 November 8 wick low, trendline support
→ 0.2060 September 17 low, deeper support
→ 0.1650 Trendline origin, August 17 low
A hold of 0.2450 and a reclaim of 0.2660 would confirm the trendline bounce and break the series of lower highs, setting up a rotation toward 0.2920, with a break above it putting the 0.3425 lower high back in view.
Losing 0.2450 would bring the 0.2375 and 0.2255 wick lows back into focus, and a loss of the trendline would be the first real break of structure since August, exposing 0.2060 as the next support with a deeper retracement if that level fails.
Hold 0.2450 and the trendline and JUP builds toward the lower highs above. Lose 0.2255 and this pullback extends toward lower support.
Bias stays neutral to cautiously bullish given the clean trendline bounce, but the series of lower highs means 0.2660 needs to be reclaimed to confirm the next leg higher.

Penafian
Maklumat dan penerbitan adalah tidak bertujuan, dan tidak membentuk, nasihat atau cadangan kewangan, pelaburan, dagangan atau jenis lain yang diberikan atau disahkan oleh TradingView. Baca lebih dalam Terma Penggunaan.
Penafian
Maklumat dan penerbitan adalah tidak bertujuan, dan tidak membentuk, nasihat atau cadangan kewangan, pelaburan, dagangan atau jenis lain yang diberikan atau disahkan oleh TradingView. Baca lebih dalam Terma Penggunaan.