An Uptrend Pattern!
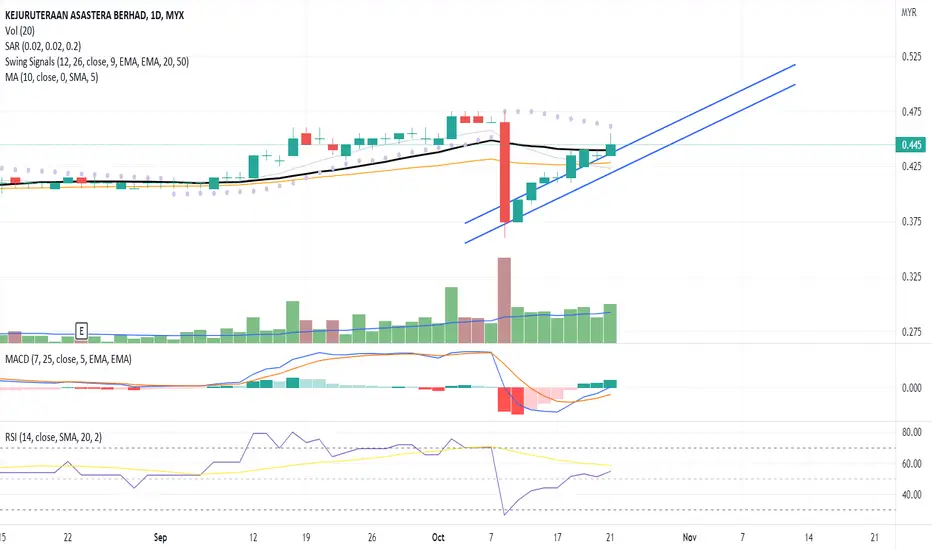
The candlestick pattern indicates a continuous price uptrend towards the MA20 line backed with high volume.
Precaution because the last candlestick indicates a "shooting star" candle, hence, the probability of price correction between the trendline channel or potential resistance area around the price range of the candle.
The MACD confirms the price uptrend towards the next price resistance.
The RSI indicates a fresh buying interest in the stock.
Let's put KAB in WL and watch out for continuous price movement toward the next price resistance backed with volume.
R 0.470
S 0.425
Precaution because the last candlestick indicates a "shooting star" candle, hence, the probability of price correction between the trendline channel or potential resistance area around the price range of the candle.
The MACD confirms the price uptrend towards the next price resistance.
The RSI indicates a fresh buying interest in the stock.
Let's put KAB in WL and watch out for continuous price movement toward the next price resistance backed with volume.
R 0.470
S 0.425

Penafian
Maklumat dan penerbitan adalah tidak bertujuan, dan tidak membentuk, nasihat atau cadangan kewangan, pelaburan, dagangan atau jenis lain yang diberikan atau disahkan oleh TradingView. Baca lebih dalam Terma Penggunaan.
Penafian
Maklumat dan penerbitan adalah tidak bertujuan, dan tidak membentuk, nasihat atau cadangan kewangan, pelaburan, dagangan atau jenis lain yang diberikan atau disahkan oleh TradingView. Baca lebih dalam Terma Penggunaan.