
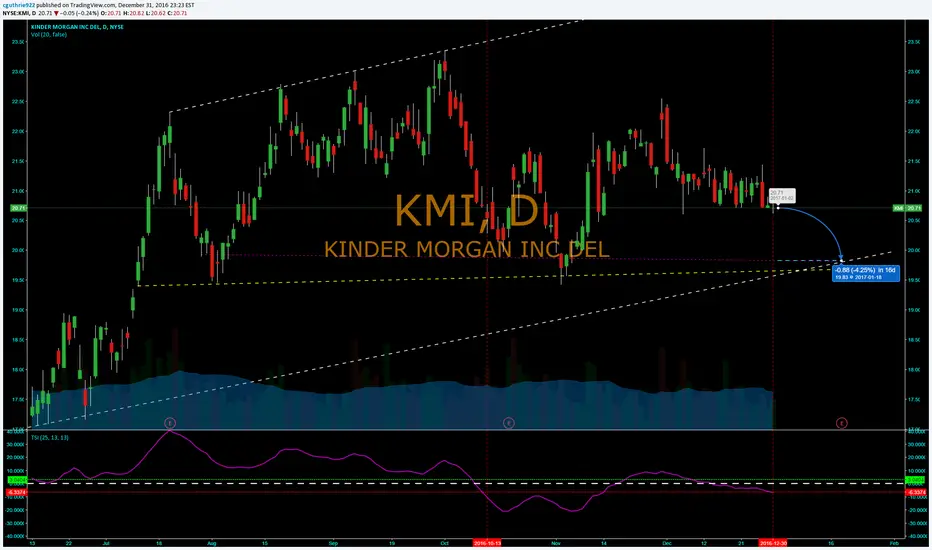
Historically when the True Strength Indicator reaches its current level the stock drops a minimum of 1.18% with an average of 5.06% over the next few weeks. I am tracking multiple potential trendchannel support levels and the first level to get hit coincides with a shared support level at 19.83. From the CLOSE on December 30, 2016, movement to this level would equate to a drop around 4.25% which is very realistic.

All forecasts are based on analysis of past behavior. Prior movements are not always indicative of future movement. Develop the theory, test the theory. Do your own research. Nothing in this analysis constitutes advice. YouTube For More. Good luck!!
Penafian
Maklumat dan penerbitan adalah tidak bertujuan, dan tidak membentuk, nasihat atau cadangan kewangan, pelaburan, dagangan atau jenis lain yang diberikan atau disahkan oleh TradingView. Baca lebih dalam Terma Penggunaan.